
The time chart wizard helps you to with the common task of building charts where a given measure (expression) should be qualified and often compared by different time periods.
As an example, you may want to show an expression such as sum(Sales) but just for the last year or the current quarter to date. Often you will also want to compare that result with the same measure for a previous period, e.g. the year before or the same quarter last year. QlikView contains a number of functions to build expressions to do this, but to the beginner they may seem hard to master. The time chart wizard has been designed to help you with the task of enclosing your basic measure expression in suitable time qualification functions according to your specifications.
Starting the Time Chart Wizard
Start the time chart wizard either by choosing Time Chart Wizard from the Tools menu or by clicking on the corresponding button in the Design toolbar.
The first time you start the wizard you are met by a start page outlining the purpose of the wizard and the basic steps involved. If you want to skip the start page when you use the wizard in the future, mark the Don't show this page again check box.
Depending on selections some of the below steps may be skipped. Move forward in the wizard by clicking Next. Click Finish in order to finalize the chart and return to the layout. Return to the chart at any time via the regular Chart Properties dialog in order to make further adjustments.
The time chart wizard takes you through the following basic steps:
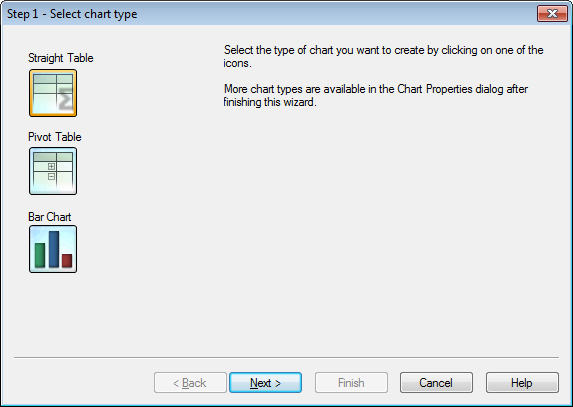
- Select the type of chart you want to create by clicking on one of the icons. The chart types available are those typically used in charts involving time period qualification. It is possible to change the chart into any other QlikView chart type via the Chart Properties dialog after finishing the wizard.
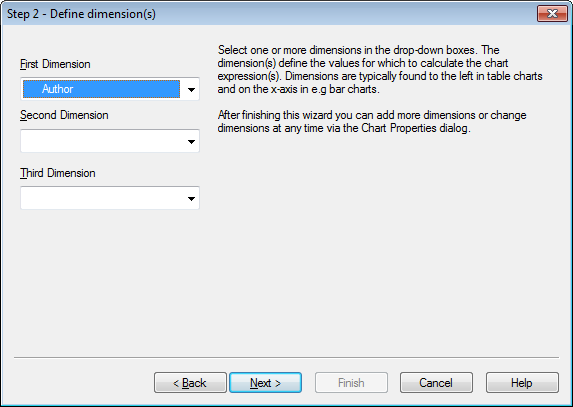
- Select one or more dimensions in the drop-down boxes. The dimension(s) define the values for which to calculate the chart expression(s).
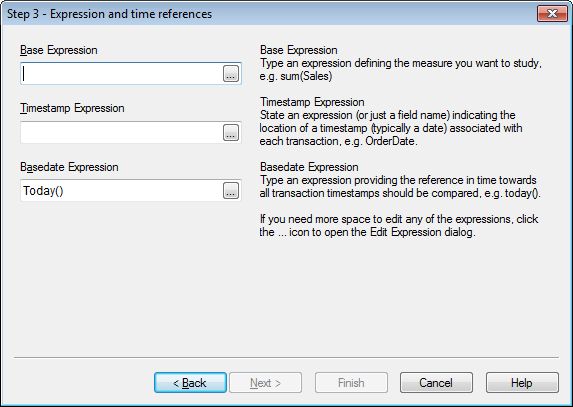
- Under Base Expression, type an expression defining the measure you want to study, e.g. sum(Sales).
- Under Timestamp Expression, state an expression (or just a field name) indicating the location of a timestamp (typically a date) associated with each transaction, e.g. OrderDate.
- Under Basedate Expression, type an expression providing the reference in time towards which all transaction timestamps should be compared, e.g. today().
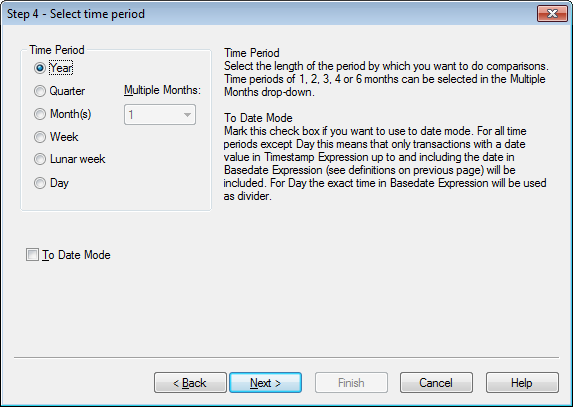
- Under Time Period, select the length of the period by which you want to qualify the chart expression and make comparisons. When using the Month(s) option, time periods of 1, 2, 3, 4 or 6 months can be selected in the Multiple Months drop-down. The value 3 can be given, but will correspond exactly to Quarter. Lunar weeks are defined as consecutive 7-day periods starting January 1st each year. There are always exactly 52 lunar weeks in a year, meaning that lunar week 52 will contain 8 or 9 days.
- Mark the check box To Date Mode if you want to use to date mode. For all time periods except Day this means that only transactions with a date value in Timestamp Expression up to and including the date in Basedate Expression (see definitions on previous page) will be included. For Day the exact time in Basedate Expression will be used as divider.
- Mark the check box Last Completed Period as Base to use the last completed period as base, e.g. the last complete quarter.
- Optionally, state an offset to the beginning of the chosen time period. Depending on the Time
Period chosen in step 6, one of the following two options
will be given:
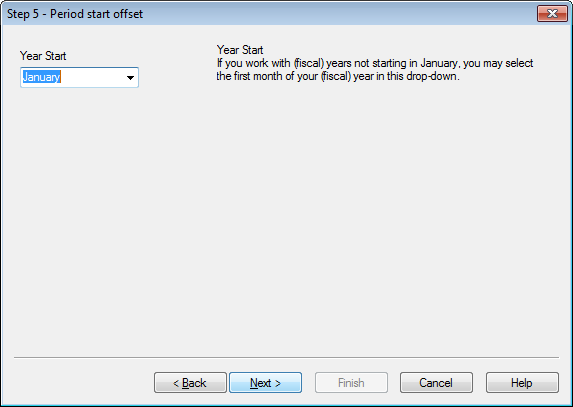
- To offset the beginning of your (fiscal) year, select the first month of your (fiscal) year in this drop-down. This option is only available if the basic Time Period chosen in step 4 above is Year, Quarter or Months.
- To offset the beginning of the week or day, input a number of days or fractions thereof, e.g. 1 for calendar week starting at Tuesday or 0.125 for day starting at 3am. This option is only available if the basic Time Period chosen in step 4 above is Week, Lunar Week or Day.
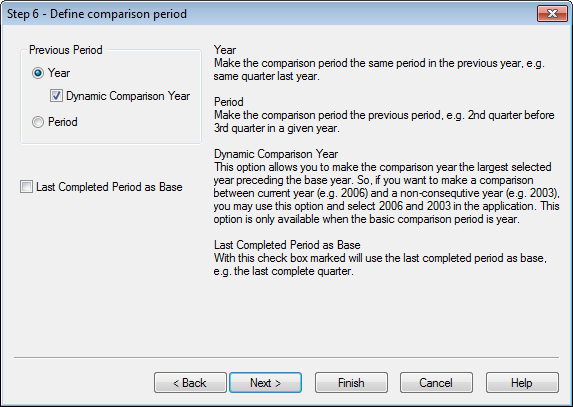
- Define the comparison period. If you have chosen Year as main Time Period in step 4 above, this page is automatically skipped.
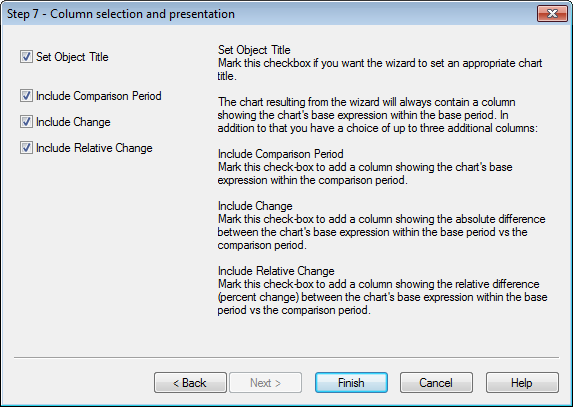
- Choose which expression columns to include in the chart.
- Mark the check box Set Object Title if you want the wizard to set an appropriate chart title.
- Mark the check box Include Comparison Period in order to add a column showing the chart's base expression within the comparison period.
- Mark the check-box Include Changein order to add a column showing the absolute difference between the chart's base expression within the base period vs the comparison period.
- Mark the check box Include Relative Change in order to add a column showing the relative difference (percent change) between the chart's base expression within the base period vs. the comparison period.