Generating report files
You can generate a report file either from the DQ Repository tree view or from the open report editor.
Generating a report file from inside Talend Studio using any of these two methods guarantees that the analysis summary in the repository is updated. However, the Refresh and Refresh All check boxes in the report editor must be selected. For further information, see Creating a new report.
Prerequisite(s):
A report file is created in the Profiling perspective. For further information, see Creating a new report.
The Generate output file check box in the Generated Report Settings view is selected.
To generate a report file from the report editor, do the following:
-
In the DQ Repository tree view, double-click the report file you want to generate.
The report editor opens on the selected report.
-
From the toolbar of the report editor, click
.
Each analysis listed in the report editor and marked to be refreshed is executed. The analysis summary is updated in the repository and the analysis results are historized in the report database (data mart) and finally a report (in pdf, html, xsl or xml format) is generated.
The generated report is listed under the Generated Document folder in the DQ Repository tree view.
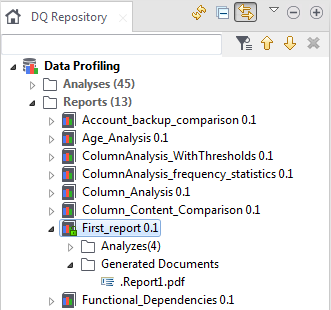 This report document will be committed on the Git server that hosts the shared repository and shared among all team members if:
-
no output folder is defined in the report editor. For further information on defining the report settings, see Creating a new report.
-
no by-default folder is defined in the Preferences window. For further information, see Setting a default report folder and logo file.
Otherwise, the report document will be stored in the defined folder but will not be committed on the Git server.
-
-
Double-click the generated document to open the report file.
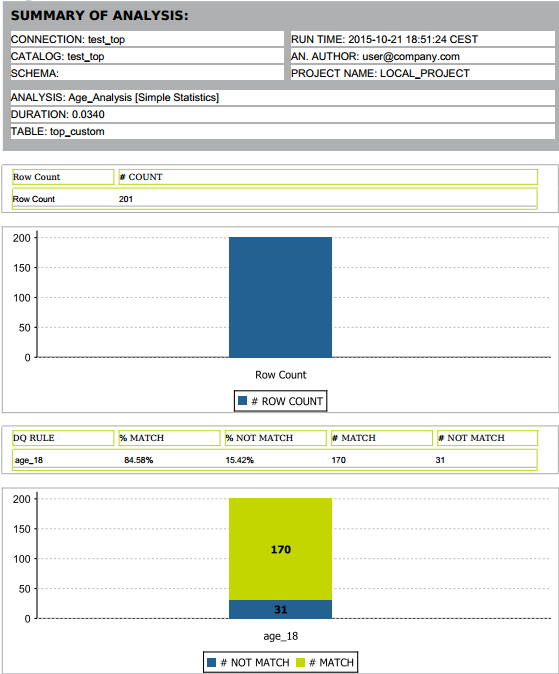
Below is an example of a generated PDF report that shows the results of all the analyses listed in the selected report.
This report illustrates the results of a table analysis where age records are evaluated against a defined SQL business rule. For further information, see Creating a table analysis with SQL business rules.
This report provides the pattern low frequency statistics for the email column. For further information, see Defining the columns to be analyzed and setting indicators.
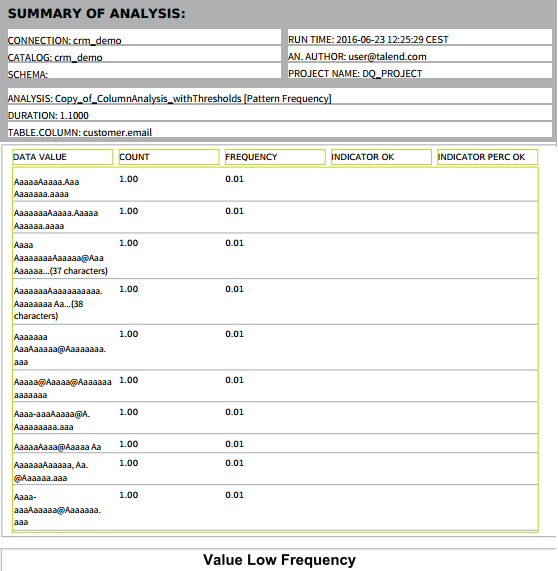
The patterns in the table use a and A to represent the email values. Each pattern can have till 30 characters. If the total number of characters exceeds 30, the pattern is represented as the following: aaaaaAAAAAaaaaaAAAAAaaaaaAAAAA...<total number of characters>.
This report provides simple statistics on the number of records in a specific column. For further information, see Defining the columns to be analyzed and setting indicators.
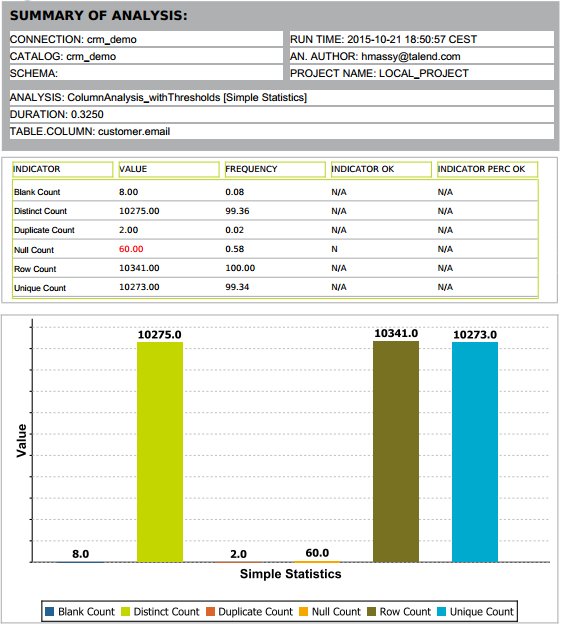
In the column analysis result table, when an indicator value is displayed in red, this means that a threshold has been set on the indicator in the column analysis editor and that this threshold has been violated. For further information about data thresholds, see Setting options for system or user-defined indicators.
Furthermore, in the result tables values in the Indicator OK column can be explained as the following:- N means a threshold has been set on the indicator in the column analysis and the indicator does not respect this data threshold.
- Y means a threshold has been set on the indicator in the column analysis and the indicator does respect the data threshold.
- N/A means no thresholds have been set on the indicator.
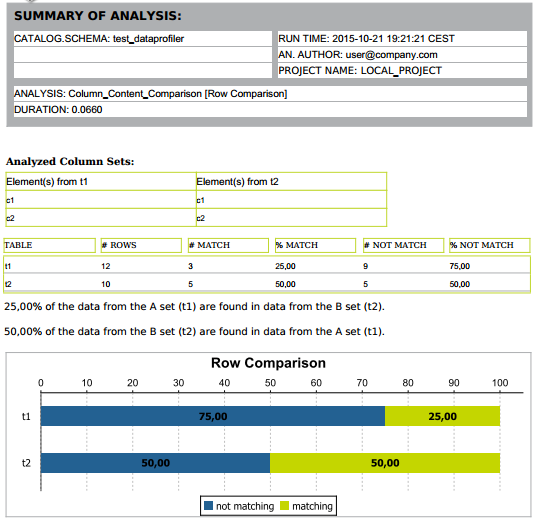
This report illustrates the results of comparing two identical columns in two different tables. For further information, see Comparing identical columns in different tables.
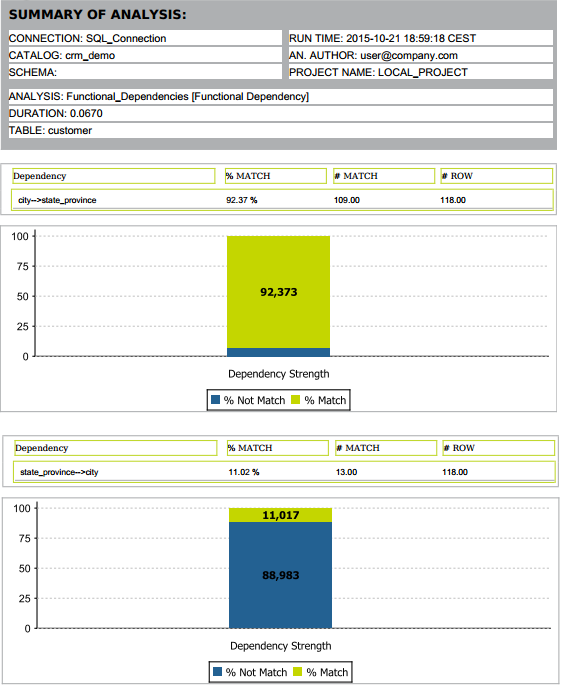
This report detects to what extent a value in a determinant column functionally determines another value in a dependent column. The returned results, in the %Match column, indicate the functional dependency strength for each determinant column. The records that do not match are indicated in red. For further information, see Detecting anomalies in columns (Functional Dependency Analysis).
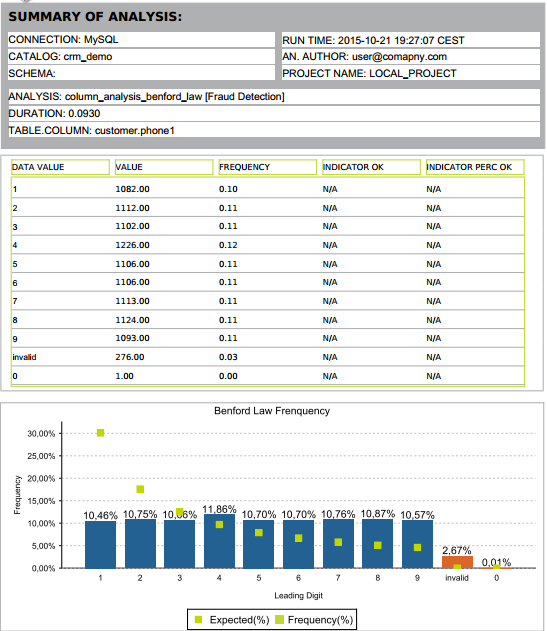
This report shows a possible case of fraudulent data through analyzing a numerical column against the Benford Law indicator. For further information, see Fraud Detection.
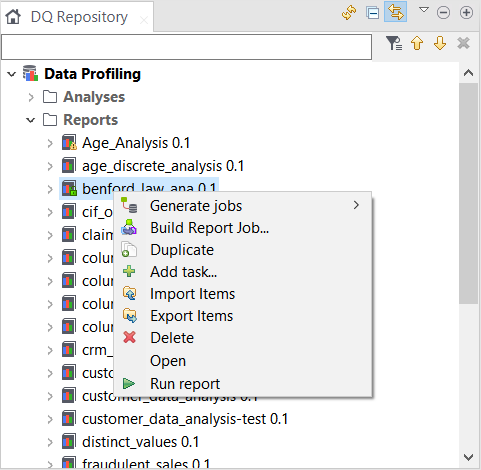
To generate a report file without opening the report editor, do the following:
-
In the DQ Repository tree view, right-click a report and select Run report from the contextual menu.
You can generate files simultaneously for several reports if you select the reports, right-click the selection and click Run report. However, when you use the HSQL database to store the report results, you can run only one report each time.
A message is displayed on the status bar showing that the operation is in progress. A file for the selected report is generated and stored in the Generated Document folder in the DQ Repository tree view.
Each analysis listed in the report editor of the selected report and marked to be refreshed is executed. The analysis summary is updated in the repository and the analysis results are historized in the report database (data mart) and finally a report (in pdf, html, xsl or xml format) is generated.
This report document will be committed on the Git server that hosts the shared repository and shared among all team members if:-
no output folder is defined in the report editor. For further information on defining the report settings, see Creating a new report.
-
no by-default folder is defined in the Preferences window. For further information, see Setting a default report folder and logo file.
Otherwise, the report file will be stored in the defined folder but will not be committed on the Git server.
-
