
Creating a new report
You can generate reports on one or more analyses that you select from the analyses
list in Talend Studio. You can
create reports on all analysis types except the correlation analyses including Numerical
Correlation Analysis, Time Correlation Analysis and Nominal Correlation
Analysis.
Defining the report
Before you begin
Procedure
-
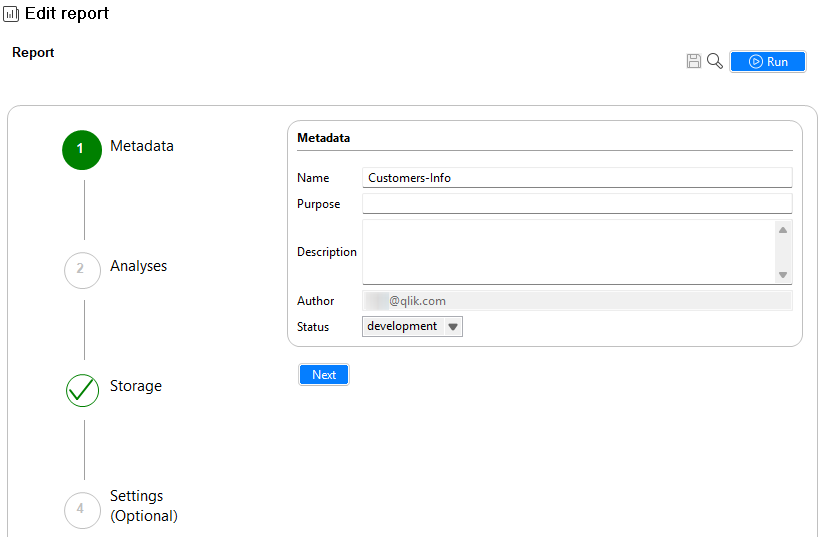
Click Finish. The Edit report
window opens.
Selecting the analyses you want to include in the report
Procedure
-
From the Analyses menu, click
 . The Analysis selection dialog box is open.
-
From the list, select the check boxes of the analyses you want to include in the
report and click OK.
 If you select a correlation analysis from the list, a warning message pops up to indicate that the analysis cannot be integrated in the report because it is not supported.The selected analyses are listed in the table.
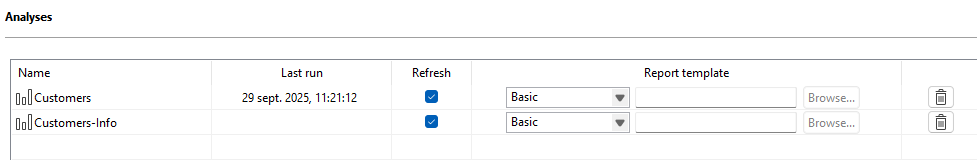
-
To run the analyses before generating the report, select the
Refresh or Refresh All check
boxes.
By selecting these check boxes, you guarantee having the latest results in your report if any of the analyses was modified meanwhile. Otherwise clear the check box next to the analysis you do not want to execute before generating the report.Another benefit of selecting these check boxes is that the analysis summary for each of the listed analyses, for example the indicator values and the execution time and duration, will be updated in the Talend Studio repository. You can access the analysis summary in the analysis results.
 However, the analysis information in the repository and thus in the Analysis Summary view will not be updated when you generate reports using a report script or using the tDqReportRun component. These two ways of generating reports will store the analysis latest values in the data mart and will show them in the report itself but will not update the analysis values in the repository.For further information on using a report script to generate reports, see Generating and exporting a report Job.For further information on using tDqReportRun to generate reports, see Generating a Job to launch a report.
Defining the report settings
Procedure
Setting a database for the report
Procedure
-
Click
 on the top-right corner.
The report is created and listed under the Reports folder in the DQ repository tree view.This new report is now ready to be generated. For more information, see Generating report files.
on the top-right corner.
The report is created and listed under the Reports folder in the DQ repository tree view.This new report is now ready to be generated. For more information, see Generating report files.