Navigate sheets and bookmarks and add assets to your sheet or visualization using the assets panel.
Click Show assets in the lower left corner of a sheet to open the assets panel.
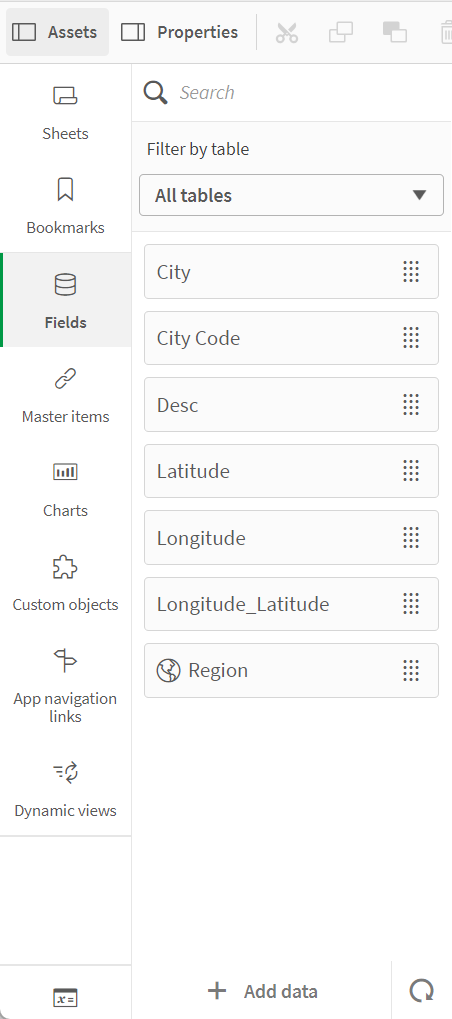
Assets panel in edit mode with Fields selected

All assets may not be available, depending on your Qlik Sense configuration.
Assets panel in edit mode
The assets panel in edit mode contains the following:
-
Sheets: View and edit sheets in the app.
-
Bookmarks: View and edit bookmarks in the app.
-
Fields: Add data to visualizations from available fields.
-
Master items: Add data to visualizations from available master items.
-
Charts: Add visualizations to the sheet.
-
Custom objects: Add custom objects to the sheet.
-
App navigation links: Add links to build on-demand apps.
-
Dynamic views: Connect a base app to a template app to use master visualizations from that app as dynamic charts in your sheets.
Fields
Fields represent the data that is available in your app. Drag a field onto a sheet to create visualizations with chart suggestions. Drag a field onto a visualization to add the field to a visualization.
Additionally, right-click on fields to do the following:
-
Create a new master dimension. See: 項目からのマスター軸の作成
-
Create a new master measure. See: 項目からのマスター メジャーの作成
-
Create a calendar measure. See: カレンダー メジャーの作成
-
View field settings. See: 1 つの値を常に選択
Date and time
All date fields are marked with and can be expanded to use date and time attributes of the field. Date and time attributes are created automatically when you use the Data manager. If you used the data load script to load data, you need to create the date and time attributes using derived fields.
See: 日付および時刻項目
Map data
All fields recognized as geopoints in map visualizations are marked with .
See: ユーザー独自のマップ データのロード
Master items
Create dimensions, measures, and visualizations as master items that can be re-used in your app.
See:
Charts
Drag charts onto your sheet to create visualizations.
See: ビジュアライゼーション
Custom objects
Enhance your apps with custom-designed visualizations.
See: カスタム オブジェクトを使用したビジュアライゼーションの作成
App navigation links
Build on-demand apps using app navigation links. On-demand apps load a subset of the data that is loaded in aggregate form by a selection app.
See: On-demand アプリの構築
Dynamic views
Create dynamic views to query and view relevant subsets of large data sets in charts that can be dynamically refreshed as selections are made.
See: ダイナミック ビューによるデータの管理
Variables
Click to open the variables dialog.
See: 変数ダイアログ
Search
検索項目を使用してアセットを検索します。検索項目にテキストを入力するに従い、検索文字列を含む名前またはタグを持つアイテムが表示されます。
See: アセット パネルでの検索
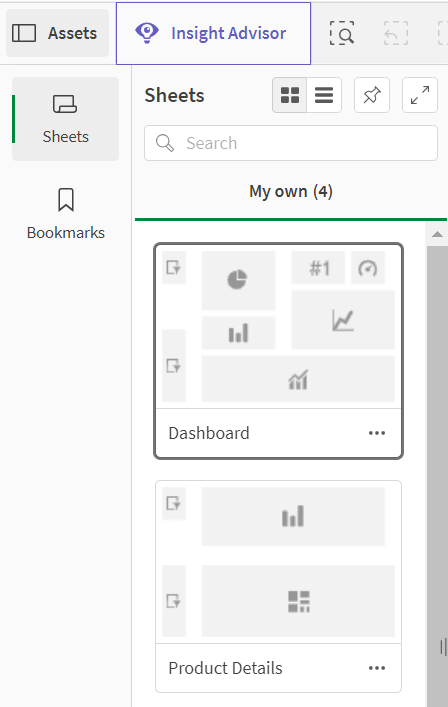
Assets panel in analysis mode
In analysis mode, click Assets to open a panel where you can create and manage the following:
-
Sheets: View and navigate sheets in the app. Create and group sheets.
-
Bookmarks: View and navigate bookmarks in the app. Create new bookmarks.
To pin the assets panel open in analysis mode, click . The assets panel can be resized by clicking and dragging the border of the assets panel.
You can make Sheets or Bookmarks full screen by clicking .
You can view Sheets as a grid or list. Sheets can also be grouped together. For more information, see シートのグループ化.
Assets panel in analysis mode

