
Nesting with TOTAL is not always enough. For more generic nesting, you will have to use the advanced aggregation function in combination with calculated dimensions.
Example:
The following data has been read from the script:
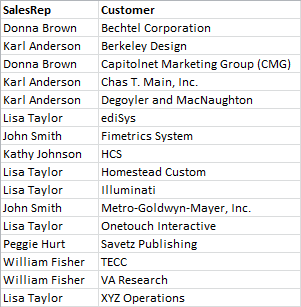
An obvious question given this data would be: "How many customers does each sales representative have?".
The question is easily answered using a standard QlikView table:
Some new questions may arise, based on the knowledge just gained: "How may sales representatives have only a single customer? How many have three or more?".
If you disregard the fact that in this simple case, it is easy to count the numbers in the expression columns by hand, these are the types of questions that require a second order of aggregation. The data necessary to make the calculation does not exist in the original fields, nor can it be directly calculated from them.
You need to find a way to use the expression column in the chart above as a dimension in a new chart. This can be obtained by using the advanced aggregation function.
To perform the calculation of the first chart as an inner chart calculation in a new chart, you need to use the following statement for the dimension:
=Aggr(Count(Customer),SalesRep)
Then, you enter the following expression for the new chart:
Count(Distinct SalesRep)
The DISTINCT qualifier is necessary, since QlikView will count the number of lines in the underlying table.
The resulting table answers the question "How many sales representatives have 1, 2, 3 etc customers?":
Two things are to be noted:
- The second chart does in no way require the presence of the first chart. It is fully self-contained with the first order aggregation defined within its dimension.
- The possibilities of nesting do not end here. The dimension arguments of the advanced aggregation function may of course contain calculated dimensions, which in turn make use of the advanced aggregation function. It would however be relatively easy to loose track of what you are doing when passing the third level of aggregation.