
The QlikView straight table has a choice for its totals between a simple sum of rows and a calculated expression total. The QlikView pivot table lacks this choice. Pivot table totals are always calculated as expression total.
This is normally a good thing, since it is a rather rare occasion that a sum of rows total is relevant when the two differ.
Having issued that warning, the following section will present an example where the sum of rows total is nevertheless the desired result.
Example:
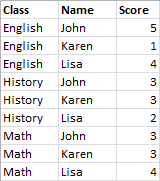
In this example, there is a school contest where teams of three students get points by their grades in three different classes. The team may select the highest score within the group for each individual class and then add the three top scores together for a total. The following data has been read from the script:
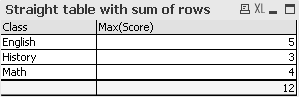
A straight table with Class as dimension and Max(Score) as expression produces the following sum of rows:
If the straight table was converted to a pivot table that is always calculated as an expression total instead of sum of rows, there would an issue:
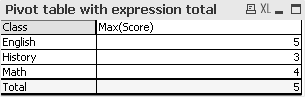
In this specific case the total of 12 is expected, and 5 is equally wrong for the purpose. In this case, the Aggr function can be used in the expression, not the dimension.
The original expression is enclosed in an Aggr function, using the surrounding chart's dimension also as dimension in the Aggr function. Now this bundle is used as argument to a Sum aggregation. The table will now show the expected total:
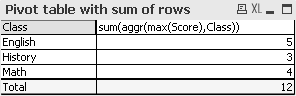
The beauty of the advanced aggregation function is that in the individual rows it will evaluate to only a single value. This is because the dimension obviously only has one possible value on each ordinary data row. Since the inner dimension and expression are the same as for the surrounding chart, each value will of course be exactly the same as the result without the enclosing Sum and advanced aggregation functions.
For the total row, however, the advanced aggregation function will return three values, one for each value of the dimension field. These will in turn be summed by the Sum aggregation. While formally still being an expression total, the result equals that of sum of rows.