To debug an extension in Visual Studio, script debugging has to be enabled in Internet Options. Proceed as follows:
- Open the Control Panel.
-
Select Network and Internet>Internet Options.
-
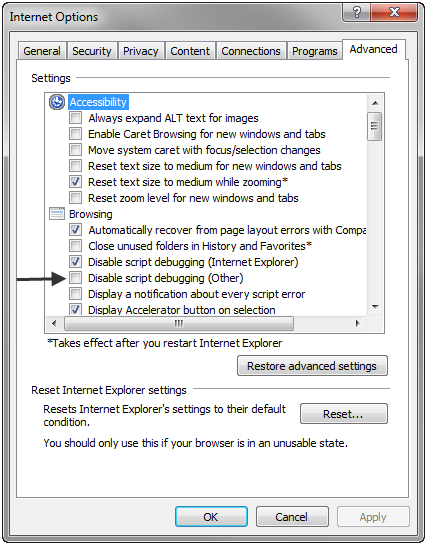
In the Internet Options dialog, select the Advanced tab.
-
Make sure that the Disable script debugging (Other) box is deselected.
-
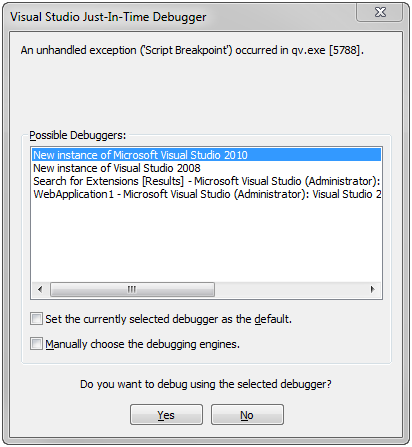
To make the execution of the extension break, add the statement debugger; anywhere in the JavaScript code. For example, the following causes Visual Studio to prompt for how to debug:
Qv.AddExtension('QlikView/Examples/HtmlText', function() { debugger; <normal_extension_code> }); -
If Visual Studio is used for developing an extension, select to debug in that instance of Visual Studio, otherwise select a new instance.