NodeGraph Insights
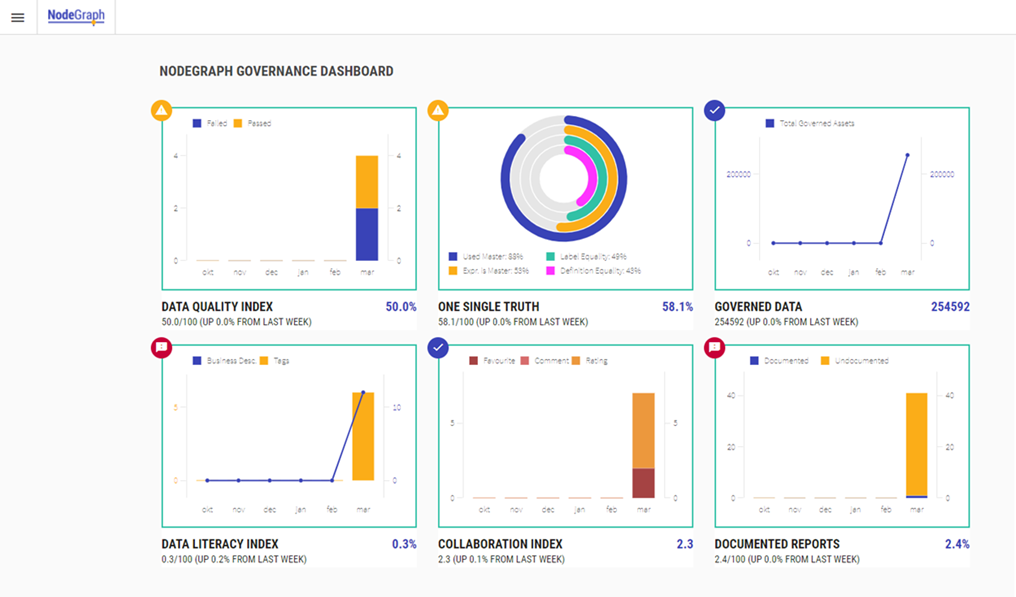
The NodeGraph Governance Dashboard contains six pre-defined KPIs. These KPIs are automatically calculated based on your NodeGraph data and are stored over time.
Governance Dashboard
Data Quality Index
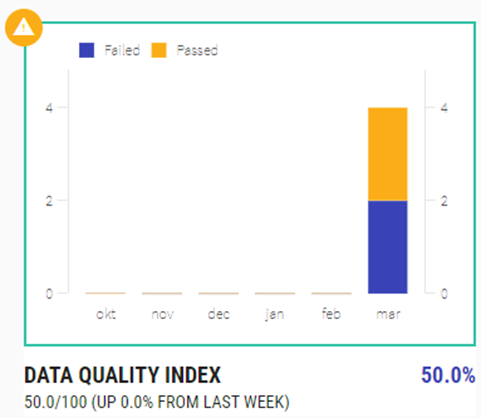
This KPI will display the number of tests that have failed during the last 24 hours. To see this KPI you need to be licensed to use the NodeGraph Data Quality Manager module.
Data Quality Index KPI
One Single Truth
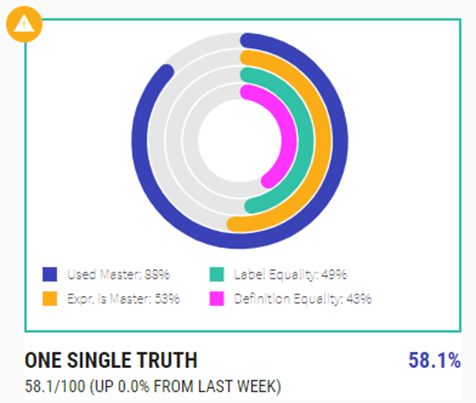
This KPI will examine your usage of master expressions and compare label names with expressions. For instance, if you have two labels with the name “Margin” but in the expressions are calculated differently, NodeGraph will score that KPI (Label) as 0%. It will also compare if the reverse is the case, i.e. the definition of the expression matches, but the labels differ. In this case too, the score will be 0%.
One Single Truth KPI
Governed Data
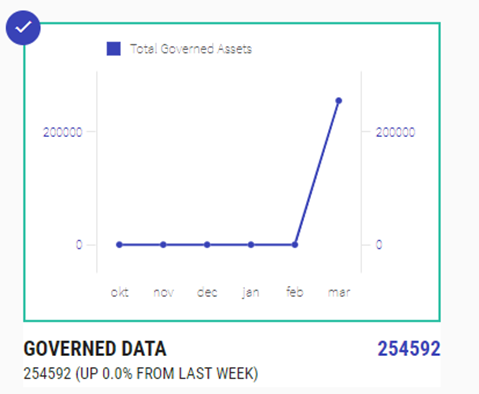
This KPI highlights the amount of data that you have in NodeGraph. The amount of data equals the number of assets that you have.
Governed Data KPI
Data Literacy Index
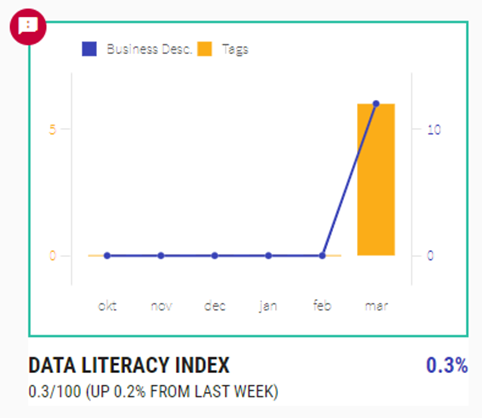
This KPI will visualize how many of your assets have a business description. It will also display how well you have used the Tags function for your assets.
Data Literacy Index KPI
Collaboration Index
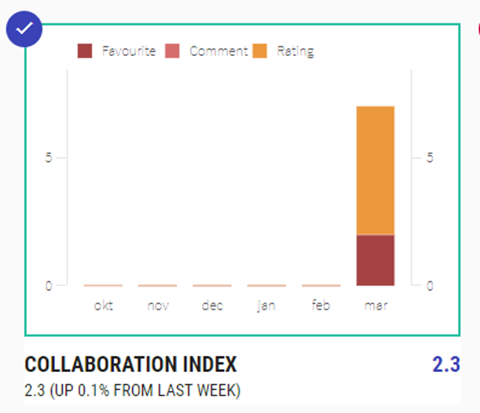
The Collaboration Index visualizes how much the organization collaborates around the data. It shows the number of favorites, comments and ratings that exist in the solution.
Collaboration Index KPI
Documented Reports
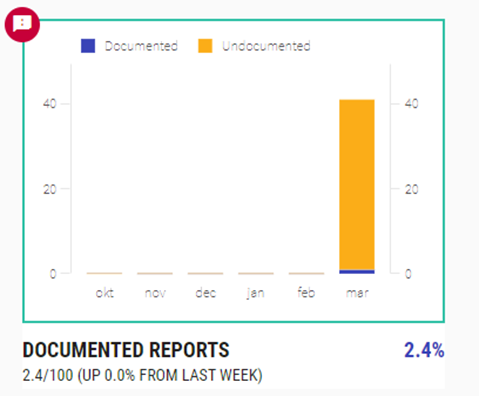
The Documented Reports KPI calculates the number of reports or applications that are being automatically documented using the Documentation module.
Documented Reports KPI
