Browsing datasets from the Catalog
From the left menu of the Qlik Talend Data Integration homepage, you can access the Catalog page. This is your tool to explore all the assets you have access to in your available spaces.
- Qlik Talend Cloud Enterprise
- Qlik Talend Cloud Premium
- Qlik Cloud Analytics Premium
- Qlik Cloud Analytics Enterprise
- Qlik Sense Enterprise SaaS
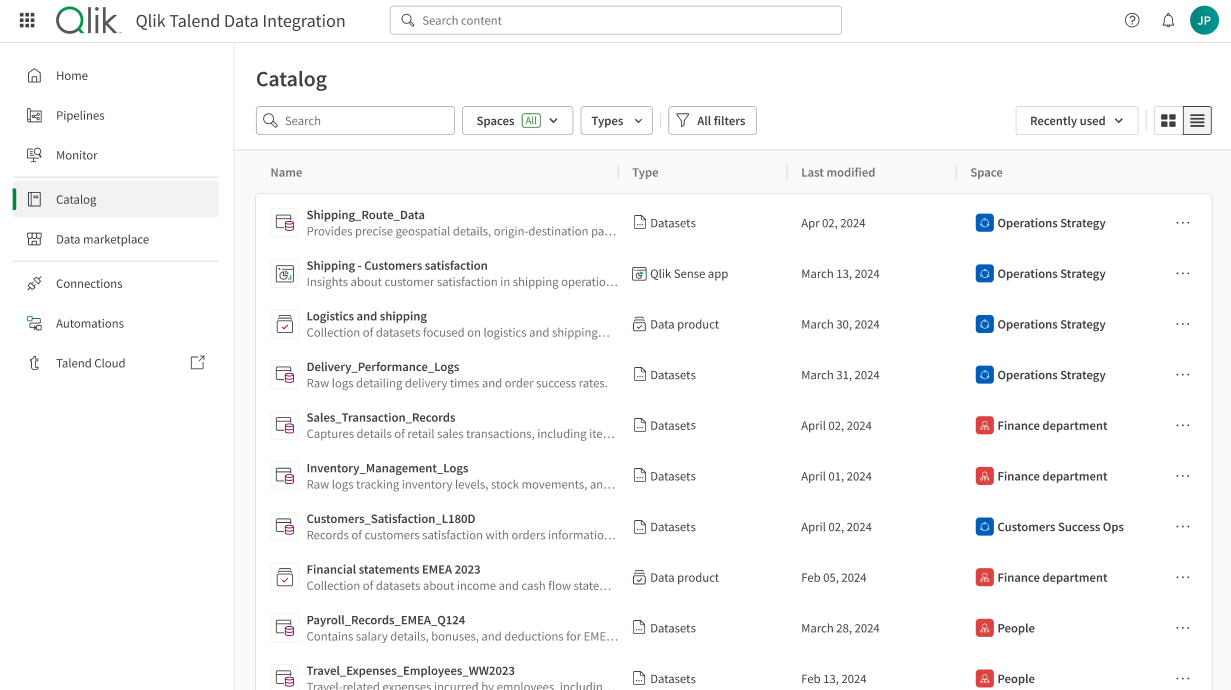
Using filters, you will be able to browse and look for trusted datasets to use in data products. Datasets can be the result of a manual upload, or created from a pipeline project when using the Publish to catalog option. For more information on publishing to Catalog, see Data pipeline project settings.
When opening a dataset from your Catalog, you can access many details, benefit from several data quality indicators and look into the data itself. This information is organized in multiple tabs.
Overview
In the Overview tab, you can get general details about your dataset as well as data quality indicators:
-
On top of the page, you can see an editable description, the data quality calculated on this dataset, or the data freshness.
You can generate the dataset description using an AI. For more information, see Generating an AI-based dataset description.
The Freshness time expresses the last update of the data source. For more information, see Configuring data quality and Data freshness.
-
At the center of the page, you can see:
- The global Qlik Trust Score™ for the selected datasets and a percentage representing their healthiness. For more information, see Qlik Trust Score™.
- An overview of the validation rules applied to the dataset. Only the four rules with the most negative impact on the quality are displayed. The impact mostly depends on the severity of the rules. For more information, see Working with validation rules.
- An overview of the dataset schema. For more information, see Managing semantic types.
-
On the bottom right side of the page, you can see the number of dependencies (Analytics applications, data flows, etc.) based on this dataset in the Used in tile, and the number of views and visitors in the View activity tile.
-
On the right panel, you can see general information about the dataset source such as the connection it is based on, the Data spaces, the tags used, the dataset creation and update dates, the dataset owner and creator.
For more information on data quality, see Assessing data quality .

Profile
The Profile tab contains graphical representations of your data. The type of visualization or histogram depends on the data type, and you can get statistics and information on the repartition of values for each field of your dataset. See Managing field-level metadata and data profiling for more information.

Data preview
You can look at the data itself in the form of a sample. For each column, you can see the data type, and the number of valid and invalid values is visible in a quality bar. Invalid values are also highlighted across the dataset.

Lineage
The Lineage tab offers a visual representation of the origin of the data contained in the dataset, such as the source table, and the data pipeline used to import it. See Analyzing lineage in Analytics for more information.

Impact analysis
The impact analysis of a dataset allows you to see the apps or data products that use this dataset and that will be impacted if you edit or delete it. See Analyzing impact analysis in Analytics for more information.

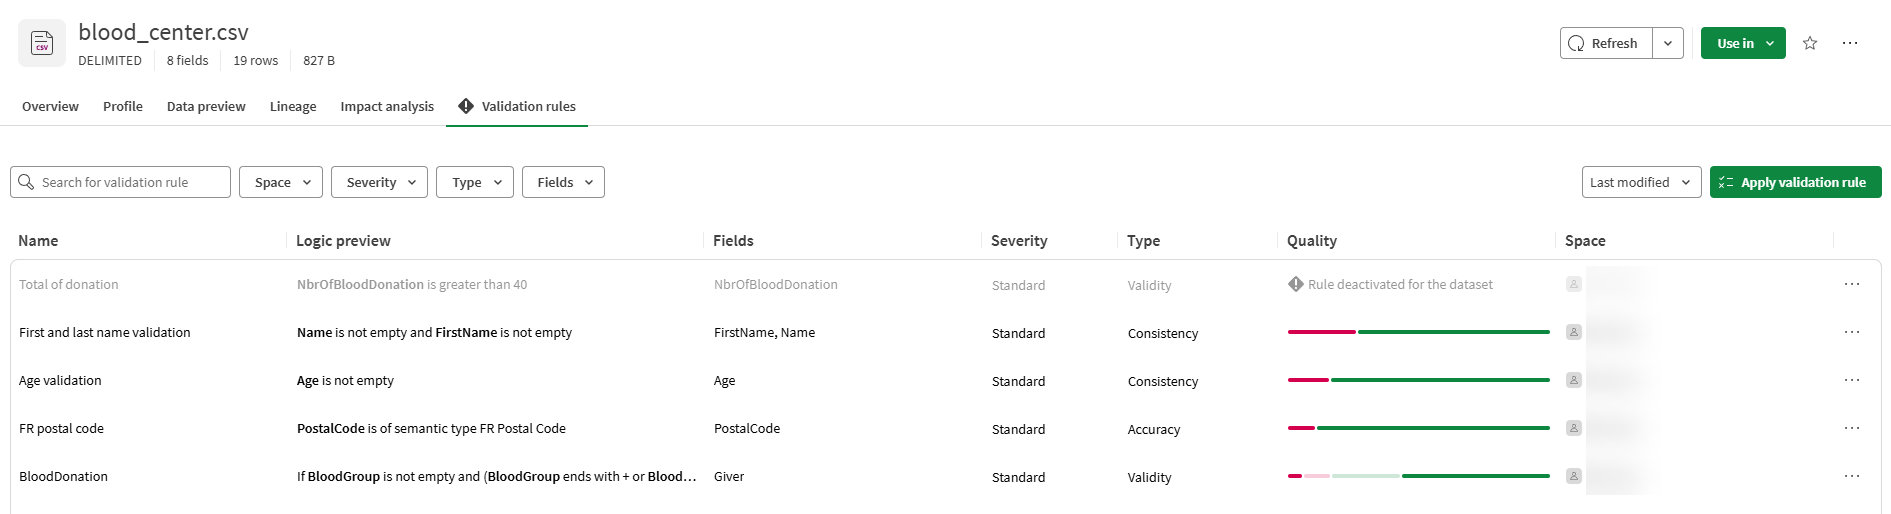
Validation rules
In the Validation rules tab, you can see all the validation rules applied to the dataset. For more information, see Working with validation rules.
From this tab, you can also edit the rules, activate or deactivate them, and remove them from the dataset.