Skip to main content Skip to complementary content

Displaying Statistics

The Statistics feature displays each component performance rate, under the flow links on the design workspace.
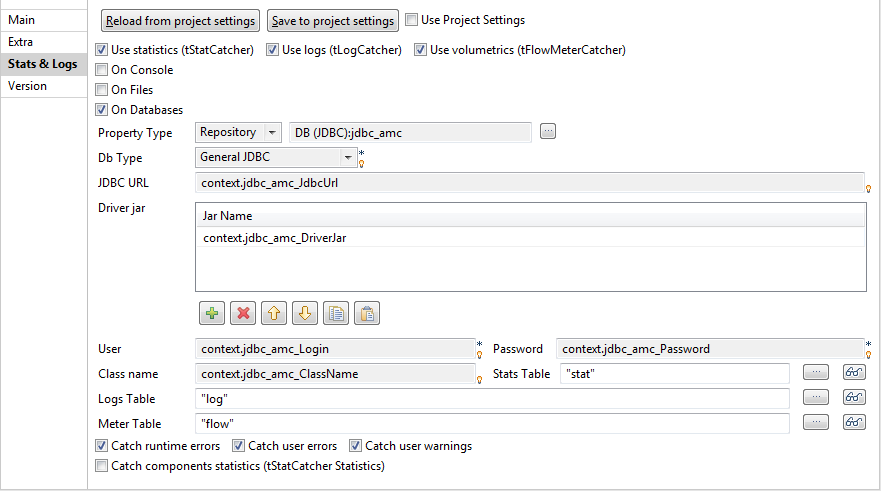
Stats & Logs view.

It shows the number of rows processed and the processing time in row per second, allowing you to spot straight away any bottleneck in the data processing flow.

For trigger links like OnComponentOK, OnComponentError, OnSubjobOK, OnSubjobError and If, the Statistics option displays the state of this trigger during the execution time of your Job: Ok or Error and True or False.

Information noteNote: Exception is made for external components which cannot offer this feature if their design does not include it.

Procedure

  • In the Run view, click the Advanced settings tab and select the Statistics check box to activate the Stats feature and clear the box to disable it.

    The calculation only starts when the Job or Route execution is launched, and stops at the end of it.

    Information noteNote: The statistics thread slows down Job or Route execution as the Job or Route must send these stats data to the design workspace in order to be displayed.
  • Click the Clear button from the Basic or Debug Run views to remove the calculated stats displayed.
  • Select the Clear before Run check box to reset the Stats feature before each execution.

Did this page help you?

If you find any issues with this page or its content – a typo, a missing step, or a technical error – please let us know!