Viewing the data analyzed against patterns
Before you begin
About this task
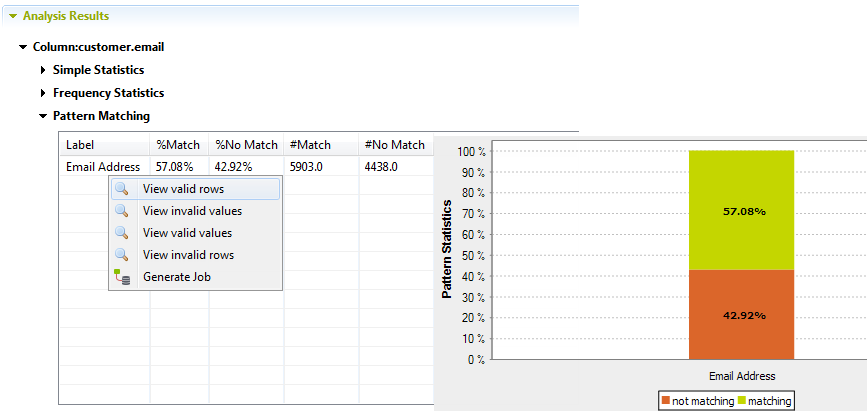
When you add one or more patterns to an analyzed column, you check all existing data in the column against the specified patterns. After the execution of the column analysis, using the Java or the SQL engine you can access a list of all the valid/invalid data in the analyzed column.
When you use the Java engine to run the analysis, the view of the actual data will open in the Profiling perspective. While if you use the SQL engine to execute the analysis, the view of the actual data will open in the Data Explorer perspective.
If you do not install these libraries, the Data Explorer perspective will be missing from Talend Studio and many features will not be available. For further information about identifying and installing external modules, see Installing external modules to Talend Studio.
To view the actual data in the column analyzed against a specific pattern, do the following:
Procedure
Results
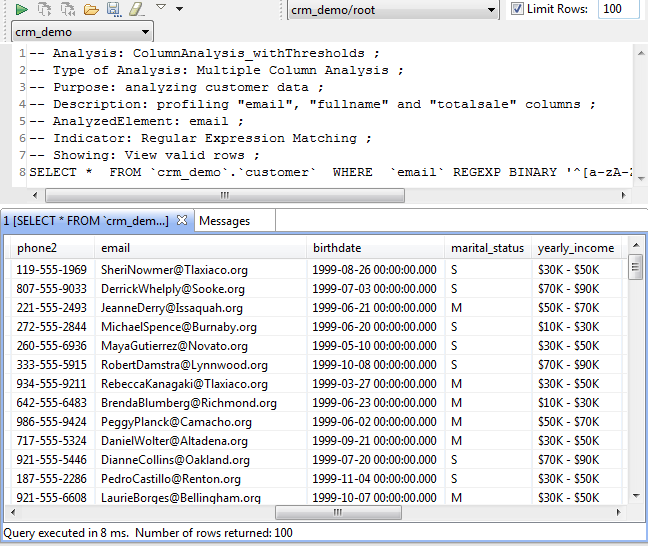
When using the SQL engine, the view opens in the Data Explorer perspective listing valid/invalid rows or values of the analyzed data according to the limits set in the data explorer.

This explorer view will also give some basic information about the analysis itself. Such information is of great help when working with multiple analysis at the same time.
The data explorer does not support connections which has empty user name, such as Single sign-on of MS SQL Server. If you analyze data using such connection and you try to view data rows and values in the Data Explorer perspective, a warning message prompt you to set your connection credentials to the SQL Server.
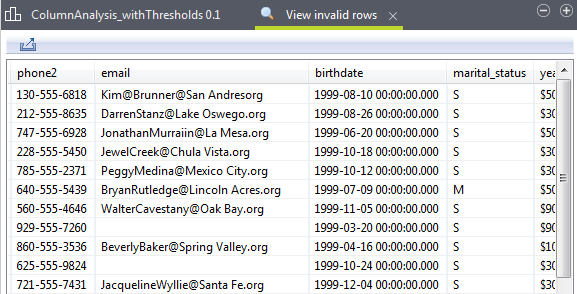
When using the Java engine, the view opens in the Profiling perspective listing the number of valid/invalid data according to the row limit you set in the Analysis parameters view of the analysis editor. For more information, see Using the Java or the SQL engine.

You can save the executed query and list it under the Libraries > Source Files folders in the DQ Repository tree view if you click the save icon on the SQL editor toolbar. For more information, see Saving the queries executed on indicators.

