Skip to main content Skip to complementary content

Column size analysis

Availability-noteDeprecated

About this task

This report analyzes the data in the datamart relative to a given database to check data storage requirements for specific columns. It highlights the columns which have the largest difference between the parametrized column size and the actual maximum size. This will help the administrator to tune the database server for better performance through making sure that the physical storage space is not wasted in any of the analyzed columns.

Information noteWarning: This report needs column analyses that use the text statistics, mainly Minimal Length, Maximal Length and Average Length. You can generate this type of report only from Talend DQ Portal , that is you can not generate it from the Profiling perspective of Talend Studio.
Prerequisite(s):
  • You have accessed Talend DQ Portal as a user.

  • At least one report has been generated on a column analysis in the Profiling perspective of Talend Studio. The column analysis must use the text statistics indicators, mainly Minimal Length, Maximal Length and Average Length.

To launch a report in order to analyze column size in a specific database, do the following:

Procedure

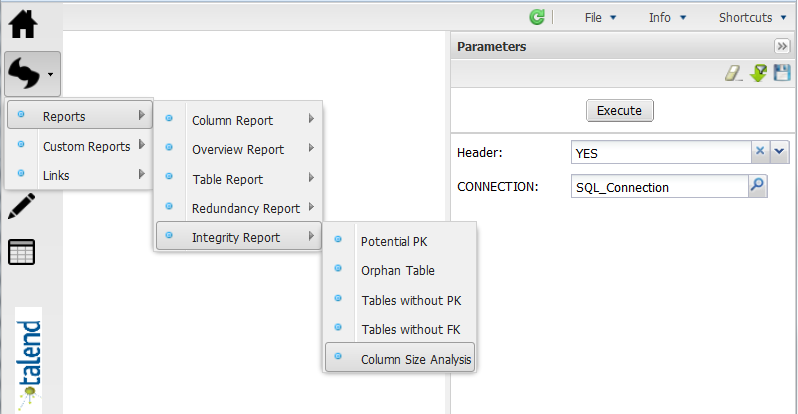
  1. From the user interface, click the icon, point to Reports > Integrity reports and then click Column size analysis.

    Example

    The corresponding page opens.
  2. Click in the Header field and select YES if you want to insert a logo in the report to launch.
    The default logo file is a Talend logo, but you can decide to use a logo of your choice. For further information, see Customizing logos in reports.
  3. Click the CONNECTION explore icon to display a dialog box that lists the database connections created in the Profiling perspective of Talend Studio.
  4. From the CONNECTION list, select the database connection used for the column analyses carried out in the Profiling perspective of Talend Studio.
  5. Click Confirm at the bottom right corner of the dialog box.
    The name of the selected connection is displayed in the CONNECTION field.
  6. Click Execute in the top of the Parameters panel.
    A loading indicator is displayed and then a report on all column analyses, if more than one exists, that use the selected database connection opens in the page.

    Example

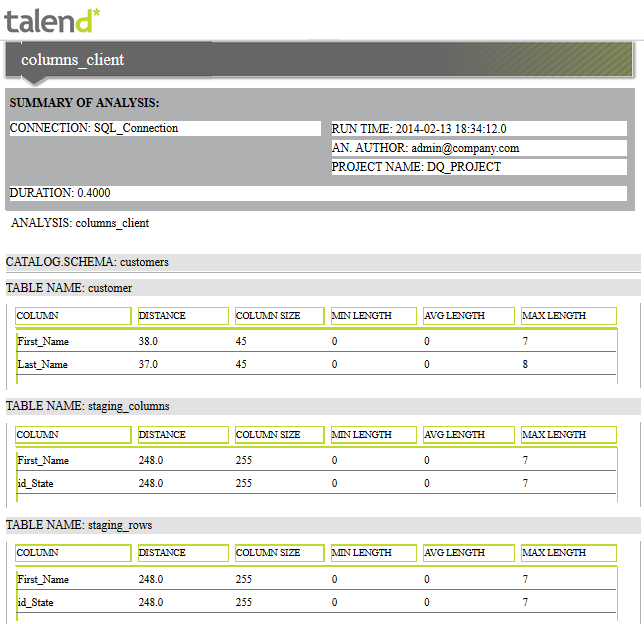
    In this example, we have three reports that have been initially generated on three column analyses in the Profiling perspective of Talend Studio. This report which is generated from Talend DQ Portal on the selected database connection gives information about all the analyzed columns in the three different analyses as the following:

    Column label

    Description

    Column

    names of the analyzed columns.

    Distance

    results of the subtraction of the Max Length from the column size. This will give information about the actual storage space used in the column.

    Column size

    data length defined for the column in the database.

    Min Length

    computes the minimal length of the text in the column.

    Average Length

    computes the average length of the text in the column.

    Max Length

    computes the maximum length of the text in the column.

    The results shown in the report help the administrator to reduce the physical storage requirements (column size) for certain columns and thus have some space savings in these columns. This column storage space tuning will result in reduced physical storage in the table and database size.
  7. In the top right corner of the page, click to save the report parameters.
    You can run a saved report without redefining its parameters, for further information, see Accessing the list of defined reports.

Did this page help you?

If you find any issues with this page or its content – a typo, a missing step, or a technical error – please let us know!