Org Chart
This video shows you how to create an Org chart in Qlik Sense and Qlik Cloud
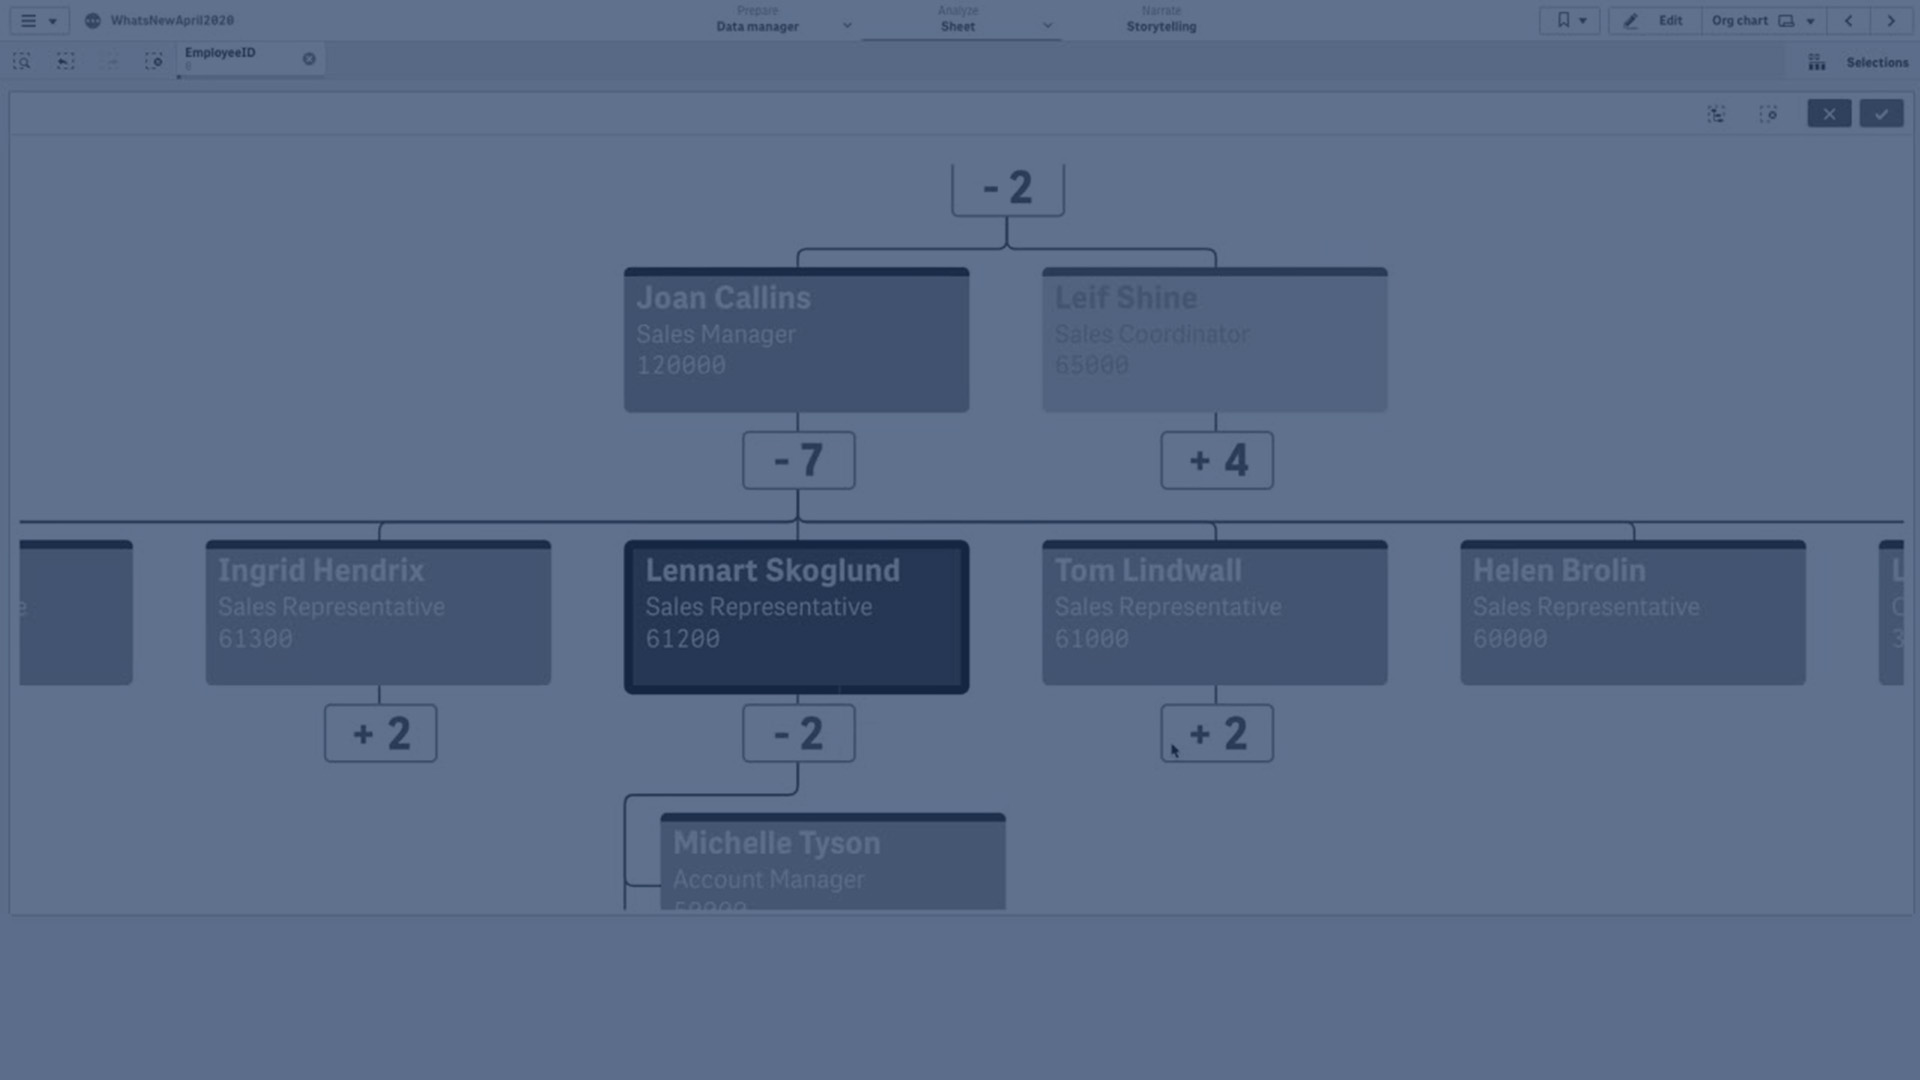
You can use the org chart to create organization charts from data with a tree structure. You can navigate through the hierarchy by expanding and collapsing the tree.
Learn how to transform raw data into dynamic organization charts that depict the intricate relationships within your organization. Navigate through the hierarchy seamlessly, expanding and collapsing nodes to unveil deeper layers of insight. Whether you're a seasoned Qlik user or a newcomer to data visualization, this tutorial equips you with the skills to harness the power of Org charts for enhanced decision-making and analysis.
Join us as we unravel the steps to create visually captivating Org charts that breathe life into your data narratives. Don't miss out on this opportunity to elevate your data visualization game and unlock new dimensions of understanding with Qlik Sense and Qlik Cloud.