
Box plot
The box plot is suitable for comparing range and distribution for groups of numerical data, illustrated by a box with whiskers, and a center line in the middle. The whiskers represent high and low reference values for excluding outlier values.
You can define the box start and end points, and whiskers ranges with a few different presets, or define your own settings using expressions.
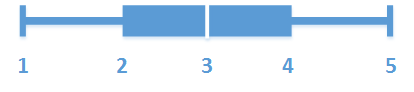
- First whisker
- Box start
- Center line
- Box end
- Last whisker
When to use it
The box plot is suitable for comparing range and distribution for groups of numerical data.
Advantages: The box plot organizes large amounts of data, and visualizes outlier values.
Disadvantages: The box plot is not relevant for detailed analysis of the data as it deals with a summary of the data distribution.
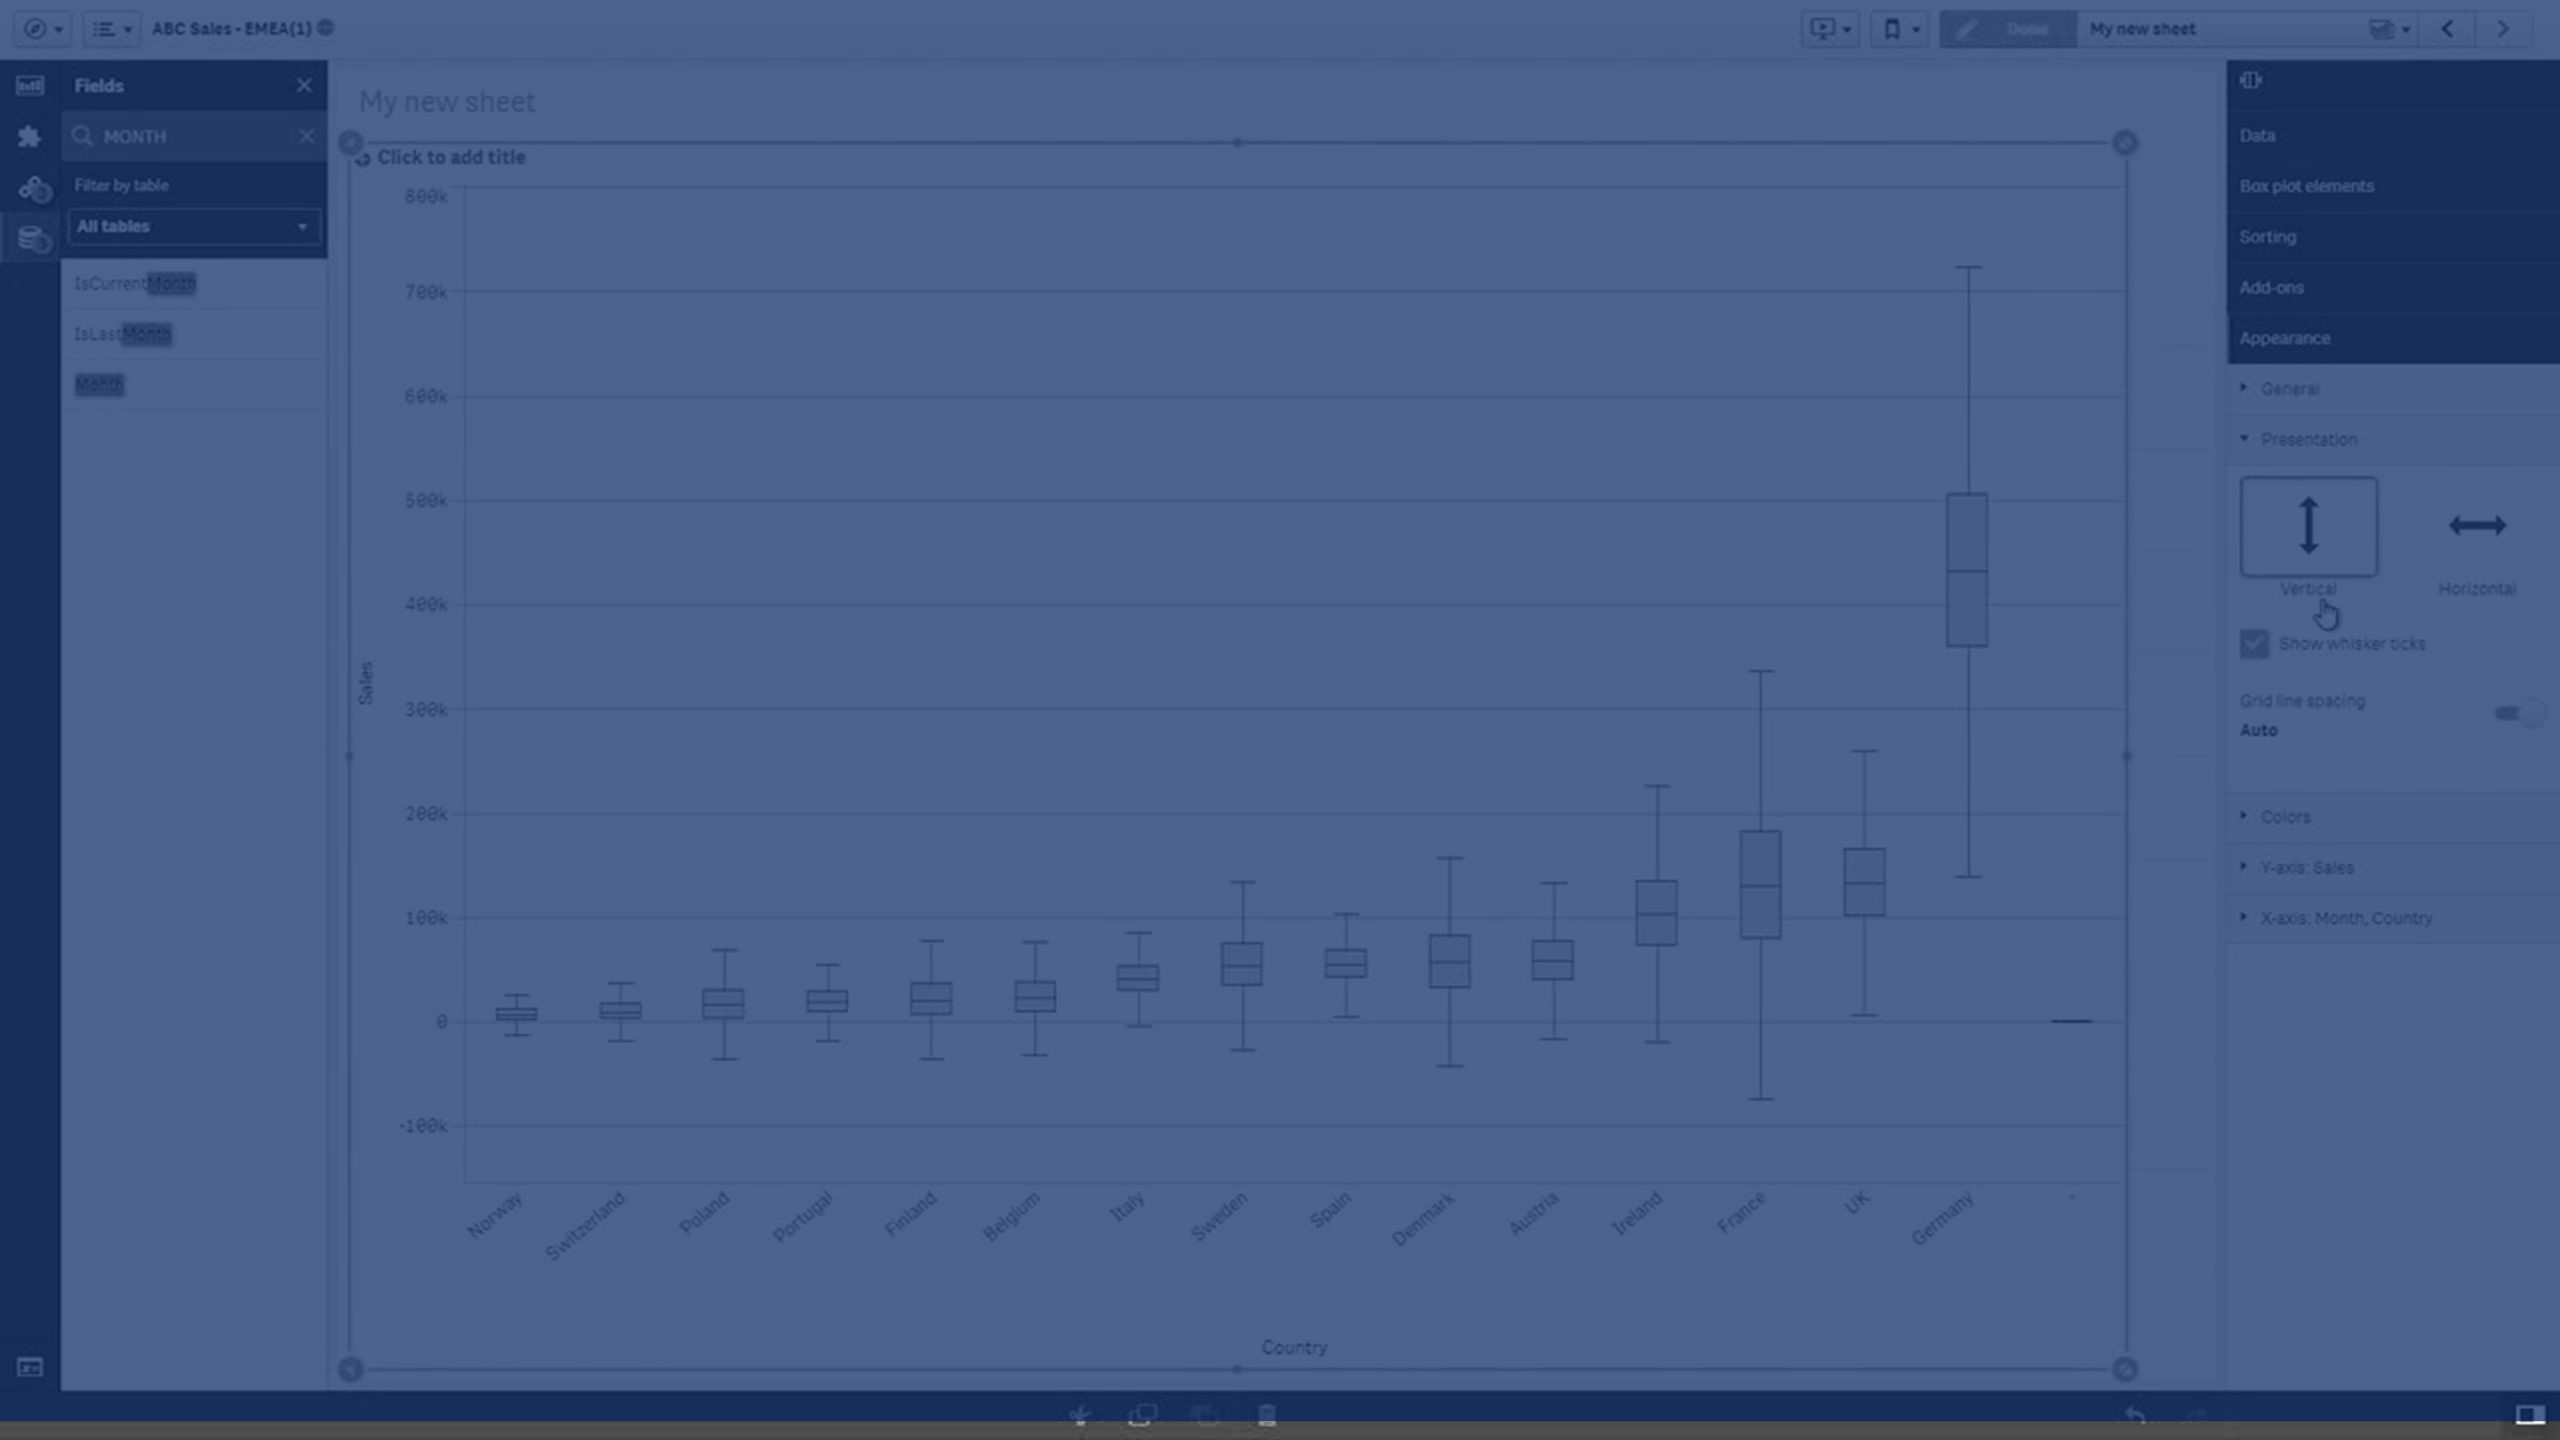
Creating a box plot
You can create a box plot on the sheet you are editing.
In a box plot you need to use one or two dimensions, and one measure. If you use a single dimension you will receive a single box visualization. If you use two dimensions, you will get one box for each value of the second, or outer, dimension.
Do the following:
- From the assets panel, drag an empty box plot to the sheet.
-
Add the first dimension.
This is the inner dimension, which defines a box.
-
Add a second dimension.
This is the outer dimension, which defines the boxes shown on the dimension axis.
-
Click Add measure and create a measure from a field. The measure does not have to contain an aggregation.
When you have created the box plot, you may want to adjust its appearance and other settings in the properties panel. By default, the Standard (Tukey) preset is used.
For more information, see Changing the appearance of a visualization.
Changing the definition of the box plot
You can use one of the three presets, found under Box plot elements in the properties panel, to define your box plot.
-
Standard (Tukey)
This preset is based on the original box plot definition by J. Tukey. The center line represents the median (second quartile), and the box start and end points represent the first and third quartiles. Whisker length can be set to 1, 1.5 or 2 inter-quartile ranges. An inter-quartile range represents the difference between the first and third quartiles.
-
Percentile-based
This preset is also defined with the box start and end points representing the first and third quartiles, and the center line representing the median, but the whisker length is adjusted by setting a percentile based whisker position.
-
Standard deviation
This preset is based on standard deviations, with the center line representing the average value, and the box start and end points representing one standard deviation variance. You can set the whisker length to a multiple of standard deviations.
You can also define a custom box plot where you set the value of each box plot element using an expression.