
The data displayed within a visualization can be changed after the visualization is created.
For example, you may want to add additional dimensions or measures to a chart to add depth to the existing data. Alternatively, you may need to correct an invalid dimension or measure.
Adding dimensions and measures to a visualization
You can add multiple dimensions and measures to a visualization to add depth to the data displayed. Addition dimensions and measures enabled you to view more information in a single visualization. For example ,the image below contains a visualization with the measure Sales and a dimension Month.
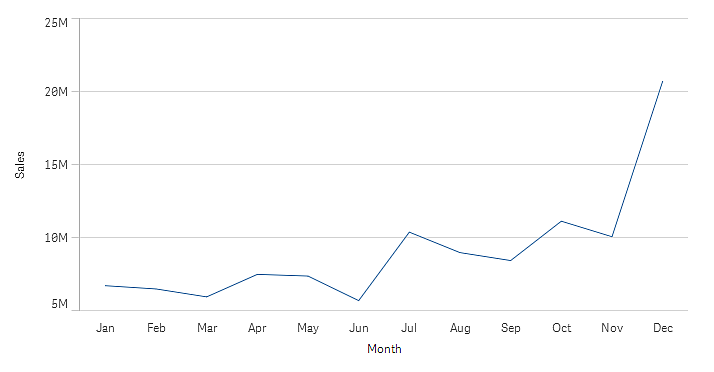
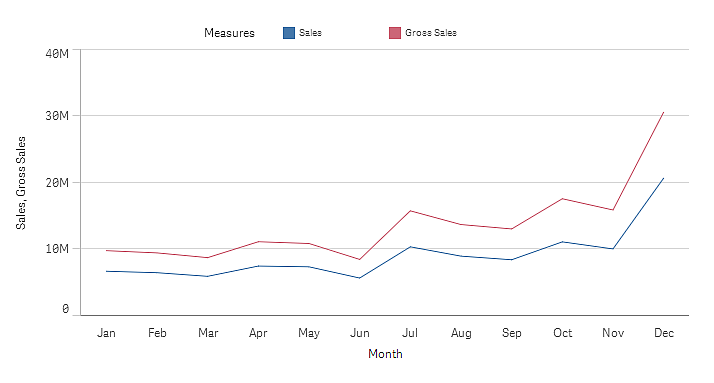
You can add a second measure, Gross Sales. The example line chart now gives use more context by enabling a comparison of Gross Sales to Sales.
Do the following:
-
In the properties panel, click the Data tab.
The Data tab is expanded.
-
In the Dimensions or Measures section, click Add to add a dimension or measure.
A dialog with a text box opens. Below the text box all available dimensions or measures are listed, grouped into Dimensions or Measures (that is master items) and Fields.
- Start typing in the text box.
A list of matching fields and dimensions or measures is displayed.
Information noteYou can also create a dimension by entering an expression directly in the text box, or by clicking to create a dimension in the expression editor.Information noteIf no measure is displayed, you need to create one. You can enter an expression directly in the text box, or you can click to create a measure in the expression editor.
 - Select the dimension or measure that you want to use.
The dimension or measure is added to the visualization. The new dimension or measure settings are shown in the properties panel.
Adding alternative dimensions and measures to a visualization
Alternative dimensions and measures are dimensions and measures that are added to a visualization, but are not displayed until a user chooses to switch which dimensions and measures are being displayed during visual exploration. You can toggle which of your dimensions and measure are displayed using the exploration menu of a visualization.
For more information, see Visual exploration.
Alternative dimensions and measures enable you conserve space on your sheets. Rather than make multiple similar visualizations of the same type, you can use alternative dimensions and measure with a single visualization. You can then switch between the displayed dimensions and measures. For example, if you wanted to see total sales by product category and total sales by product subcategory, you could add product category as a dimension and product subcategory as an alternate dimension in the same visualization.
Alternative dimensions and measure enable you to have more dimensions and measures associated to a visualization that the display limit. Many visualizations have limitations on how many dimensions and measures that can be displayed at the same time. A line chart with two or more measures can only have one dimension, and a line chart with two dimensions can only have one measure. Alternative dimensions and measures enable you to exceed that limit.
Alternative dimensions and measures can be added like normal dimensions and measures in the properties pane. You can also drag dimensions and measures in the Data section of the properties panel into the Alternative dimensions or Alternative measures section.
Do the following:
-
In the properties panel, click the Data tab.
The Data tab is expanded.
-
In the Dimensions or Measures section, click Add alternative.
A dialog with a text box opens. Below the text box all available dimensions or measures are listed, grouped into Dimensions or Measures (that is master items) and Fields.
- Start typing in the text box.
A list of matching fields and dimensions or measures is displayed.
Information noteYou can also create a dimension by entering an expression directly in the text box, or by clicking to create a dimension in the expression editor.Information noteIf no measure is displayed, you need to create one. You can enter an expression directly in the text box, or you can click to create a measure in the expression editor. - Select the dimension or measure that you want to use.
The alternate dimension or measure is added to the visualization.
Editing data in a visualization
You can edit and adjust the data in a visualization. You may need to edit an existing dimension or measure to adjust it to create a stronger visualization or correct an invalid dimension or measure. You may also want to edit a master item in a visualization to change the master item across all visualizations.
Invalid dimensions and measures
Dimensions and measures are invalid when the associated expression cannot be interpreted by Qlik Sense.
If you create an invalid dimension or edit an existing one so that it becomes invalid, the dimension is presented in the properties panel as dimmed with a red hue and the text Invalid dimension to indicate that the dimension is invalid. If you use an invalid dimension in a visualization, the visualization cannot be displayed.
If you create an invalid measure or edit an existing one so that it becomes invalid, the Expression text box under Measures in the properties panel is presented with a red border to indicate that the measure is invalid.
Editing a dimension
You can edit dimensions, including master dimensions, in the properties panel. Select the dimension that you want to edit. Dimensions have the following properties:
- Field: Start typing the field name to display a list of matching fields to choose from. You can also click to open the expression editor, where you can create a calculated dimension.
- Label: Enter a name for the dimension.
- Include null values: When this is checked, the visualization will include the null values of the dimension, presented as a gap or a dash, depending on the type of visualization. For example, if you have sales figures but do not have any information about what company the figures belong to, the figures will be added to the measure value for the null value dimension.
- Limitation: You can limit the number of dimension values that are displayed.
- Show others: When you have set a limitation for the number of dimension values displayed, you have an option to summarize the measure values for the remaining dimensions by selecting Show others.
- Master item: Edit a master dimension to update all instances where the dimension is used, or create a new master dimension by adding a dimension to the master items.
Editing a measure
You can edit measures, including master dimensions, in the properties panel. Select the measure that you want to edit. Measures have the following properties:
- Expression: Enter the expression. You can also click to open and use the expression editor.
- Label: Enter a name for the measure. The label is not automatically updated when you make changes in Expression.
- Number formatting: Set the number formatting for the measure values. The options Number and Date offer custom formatting options for defining your own format pattern.
- Master item: Edit a master measure to update all instances where the measure is used, or create a new master measure by adding a measure to the master items.
Editing master items
Dimensions and measures that are linked to a master item are displayed with a ![]() in the properties panel. You can edit the master item to update all instances that use the dimension or measure, or you can unlink the item from its master to edit only the current instance of the dimension or measure.
in the properties panel. You can edit the master item to update all instances that use the dimension or measure, or you can unlink the item from its master to edit only the current instance of the dimension or measure.
A visualization that is linked to a master item is indicated by ![]() Linked visualization on the sheet. You can edit a master visualization to update all instances that use the visualization, or you can unlink a visualization from its master to edit only the current instance of the visualization. Unlinking a visualization does not unlink any master dimensions or master measures used in the visualization.
Linked visualization on the sheet. You can edit a master visualization to update all instances that use the visualization, or you can unlink a visualization from its master to edit only the current instance of the visualization. Unlinking a visualization does not unlink any master dimensions or master measures used in the visualization.
For more information about editing master items, see Editing a master dimension, Editing a master measure, and Editing a master visualization.
For more information about unlinking from master items, see Unlinking from a master item and Unlinking from a master visualization.
Deleting dimensions and measures
In the properties panel, you can delete a dimension or measure. Long-touch or right-click the dimension or measure and select Delete in the dialog. Alternatively, click the dimension or measure and click Delete![]() . If you delete an instance of a master item, the master item is still available in the assets panel.
. If you delete an instance of a master item, the master item is still available in the assets panel.