
Reporting an Issue
When reporting an issue, there is some information you should collect beforehand.
Steps
- Sign in as a user with at least the Application Administratorcapability global role assignment.
- Get the Application Server and Database Server Details by going to either:
- Go to MANAGE > System
- Click Download (top right) to obtain a TXT file of the application and database server Information
- Click Operations (top left) > Get repository content statistics (run script and save log)
- Click Operations (top left) > Test performance (run script and save log)
- Get the Database Maintenance Status by going to either:
- Go to MANAGE > Schedules
- Select the schedule (top panel) Run Database Maintenance
- Select the latest execution in the History (bottom panel) and click View Log (on the right)
- In the Log Messages dialog, click on Show All (bottom), and Save
- Get the Repository Content Statistics for (each) Configuration by going to:
- Go to Objects > Statistics In the banner, click on Download (top left) the CSV file of the configuration statistics.
- Get the System Log by going to
- Go to MANAGE > System and select Enable in the Debug Logging pull-down.
- Reproduce the issue to report
- Go to MANAGE > System and select Disable in the Debug Logging pull-down.
- Zip up the debug logs and attach to the ticket.
Debug level messages are not shown in MANAGE > System Logs, nor is it part of the download there. Instead, when you enable debug logging, those messages are written to the Tomcat server logs (catalina.log) on the application server machine. You may find this file in the installation directory at
$MM_HOME/data/logs/tomcat/
And zip the catalina.log file up and provide it with the ticket.
Now, since a restart resets the level, if the issue is related to something that happens on server start, you must do something special and enable debug logging on startup by editing the $MM_HOME/conf/conf.properties file and setting the MIR_LOG_LEVEL to 6. The line should be uncommented, and the value changed from 5 to 6. Then restart the application server and capture the $MM_HOME/data/logs/tomcat/catalina.log file.
- For any import bridge issues, go to MANAGE > Configuration, select the model, click IMPORT
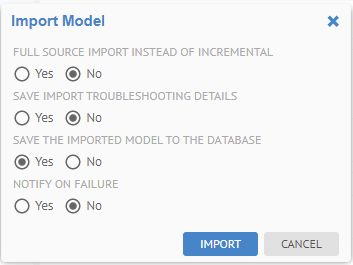
- and specify:
- FULL SOURCE IMPORT INSTEAD OF INCREMENTAL
- SAVE IMPORT TROUBLESHOOTING DETAILS
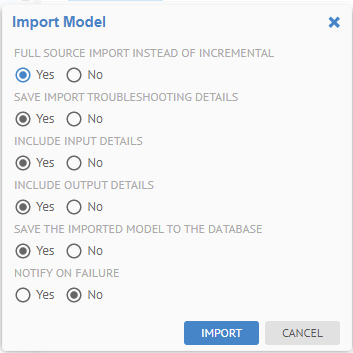
The SAVE IMPORT TROUBLESHOOTING DETAILS selection causes a debug package to be produced. This package is a zip file that contains the artifacts required to reproduce the issue. Without this information, it may be impossible to reproduce and thus resolve a reported issue. Also, the dialog will change providing additional options. Please be sure to specify INCLUDE INPUT DETAILS and INCLUDE OUTPUT DETAILS.

- Open the log when the import is completed and click Download troubleshooting details.
- Attach the debug package (zip file downloaded) to the ticket.
- Finally, if it a UI issue and you are requested to, please use the below steps to capture the .HAR file.