Skip to main content Skip to complementary content

Finalizing and executing the analysis of a set of columns

What is left before executing this set of columns analysis is to define the indicator settings, data filter and analysis parameters.

Before you begin

A column set analysis has already been defined in the Profiling perspective of the Talend Studio.

Procedure

  1. From the Settings menu, set the number of concurrent connections allowed per analysis in the Number of connections per analysis field.
    You can set this number according to the database available resources, that is the number of concurrent connections each database can support.
  2. Select the Execution engine.
    When you select the Java engine, the Store data check box is selected by default and cannot be unselected. Once the analysis is executed, the profiling results are always available locally to drill down through the analysis results > Data view.

    Executing the analysis with the Java engine uses disk space as all data is retrieved and stored locally. If you want to free up some space, you may delete the data stored in the main Talend Studio directory, at Talend-Studio/workspace/project_name/Work_MapDB.

    When you select the SQL engine, you can use the Store data check box to decide whether to store locally the analyzed data and access it in the analysis results.
    Information noteNote: If the data you are analyzing is very big, it is advisable to leave the Store data check box unselected in order not to store the results at the end of the analysis computation.
  3. Select the Store data check box if needed.
  4. To use contexts, click Open context view.
    The Context view opens and you can manage the contexts. For further information about contexts and variables, see Using context variables in analyses.
  5. Click Save and run.
    Overview of the Simple Statistics section in the analysis results.

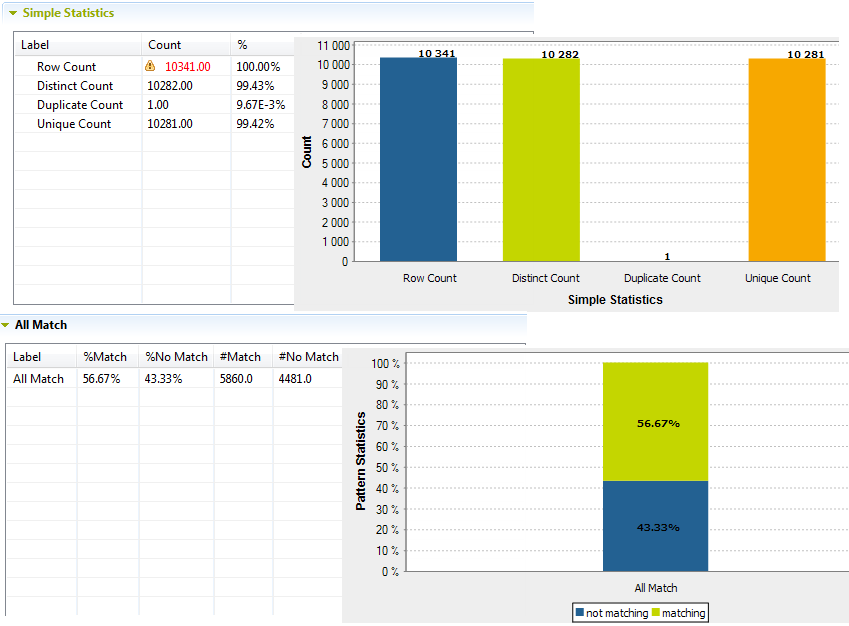
    The analysis editor switches to the analysis results where you can read the analysis results in tables and graphics. The graphical result provides the simple statistics on the full records of the analyzed column set and not on the values within each column separately.

    When you use patterns to match the content of the set of columns, another graphic is displayed to illustrate the match and non-match results against the totality of the used patterns.

  6. In the Simple Statistics table, right-click an indicator result and select View Rows or View Values.
    • When you run the analysis with the Java engine, a list of the analyzed data is opened in the Profiling perspective.
    • When you run the analysis with the SQL engine, a list of the analyzed data is opened in the Data Explorer perspective.
  7. In the Data view, click Filter data to filter the valid/invalid data according to the used patterns.
    You can filter data only when you run the analysis with the Java engine.
    For further information, see Filtering data against patterns.

What to do next

You can generate a ready-to-use Job to group the valid/invalid rows and write them in two separate files. In the All Match table, right-click the result row and select Generate an ETL job to handle rows. The Job will be created in the Integration perspective.
Information noteRestriction: The All Match table is available only when you run the analysis with the Java engine.

Did this page help you?

If you find any issues with this page or its content – a typo, a missing step, or a technical error – please let us know!