Editing rules and displaying sample results
- Big Data Platform
- Cloud API Services Platform
- Cloud Big Data Platform
- Cloud Data Fabric
- Cloud Data Management Platform
- Data Fabric
- Data Management Platform
- Data Services Platform
- MDM Platform
- Qlik Cloud Enterprise Edition
- Qlik Talend Cloud Enterprise Edition
- Qlik Talend Cloud Premium Edition
- Real-Time Big Data Platform
Procedure
-
To define a second match rule, put your cursor on the top right corner of
the Matching Key table, click the [+] button to create a new rule.
Follow the steps outlined in Defining a match rule to define matching keys.When you define multiple conditions in the match rule editor, an OR match operation is conducted on the analyzed data. Records are evaluated against the first rule and the records that match are not evaluated against the second rule and so on.
-
Click
at the top right corner of the Matching Key or Match and Survivor section and replace the default name of the rule with a name of your choice.
If you define more than one rule in the match analysis, you can use the up and down arrows in the dialog box to change the rule order and thus decide what rule to execute first. -
Click OK.
The rules are named and ordered accordingly in the section.
-
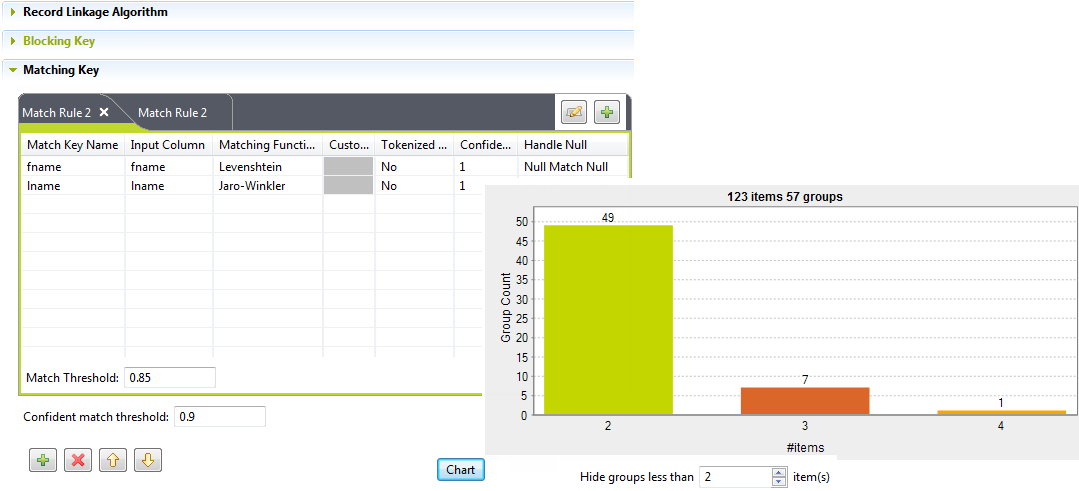
In the Match threshold field, enter the
match probability threshold.
Two data records match when the probability is above this value.In the Confident match threshold field, set a numerical value between the current Match threshold and 1.If the GRP-QUALITY calculated by the match analysis is equal to or greater than the Confident match threshold, you can be confident about the quality of the group.
-
Click Chart to compute the groups
according to the blocking key and match rule you defined in the editor and
display the results of the sample data in a chart.
 This chart shows a global picture about the duplicates in the analyzed data. The Hide groups less than parameter is set to 2 by default. This parameter enables you to decide what groups to show in the chart, you usually want to hide groups of small group size.The chart in the above image indicates that out of the 1000 sample records you examined and after excluding items that are unique, by having the Hide groups less than parameter set to 2:
-
49 groups have 2 items each. In each group, the 2 items are duplicates of each other.
-
7 groups have 3 duplicate items and the last group has 4 duplicate items.
Also, the Data table indicates the match details of items in each group and colors the groups in accordance with their colors in the match chart. -
Did this page help you?
If you find any issues with this page or its content – a typo, a missing step, or a technical error – please let us know!
