Running a Job in Traces Debug mode
The traces feature allows you to monitor data processing when running a Job in the Integration perspective of Talend Studio.
It provides a row by row view of the component behavior and displays the dynamic result next to the Row link on the design workspace.

This feature allows you to monitor all the components of a Job, without switching to the debug mode, hence without requiring advanced Java knowledge.
The Traces function displays the content of processed rows in a table.
Exception is made for external components which cannot offer this feature if their design does not include it.
You can activate or deactivate Traces or decide what processed columns to display in the traces table that displays on the design workspace when launching the current Job.
To activate the Traces mode in a Job:

- Click the Run view.
- Click the Debug Run tab to access the debug and traces execution modes.
- Click the down arrow of the Java Debug button and select the Traces Debug option. An icon displays under every flow of your Job to indicate that process monitoring is activated.
- Click the Traces Debug to execute the Job in Traces mode.
To deactivate the Traces on one of the flows in your Job:

- Right-click the Traces icon under the relevant flow.
- Select Disable Traces from the list. A red minus sign replaces the green plus sign on the icon to indicate that the Traces mode has been deactivated for this flow.
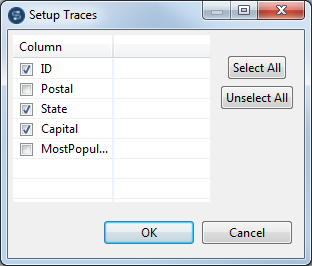
To choose which columns of the processed data to display in the traces table, do the following:
- Right-click the Traces icon for the relevant flow, then select
Setup Traces from the list. The Setup
Traces dialog box appears.

- In the dialog box, clear the check boxes corresponding to the columns you do not want to display in the Traces table.
- Click OK to close the dialog box.

Monitoring data processing starts when you execute the Job and stops at the end of the execution.
To remove the displayed monitoring information, click the Clear button in the Debug Run tab.
