Previewing data
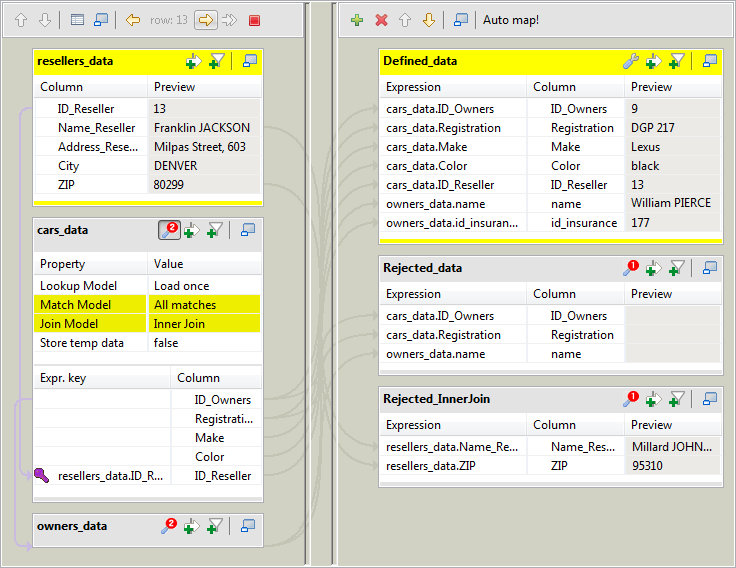
Like the Traces Debug mode of the Run view that allows you to monitor data processing during Job execution, the tMap component offers you that same functionality in its editor. This allows you to monitor the data mapping and processing before the execution while configuring the tMap component.
To preview data mapping and processing during tMap configuration:
-
Activate the Traces Debug mode in the Run view. For more information regarding the Traces Debug execution mode and how to activate it, see Running a Job in Traces Debug mode.
-
Double-click tMap on the design workspace to open its editor.

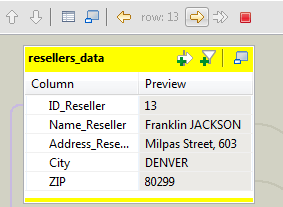
A new Preview column displays in the main input table and in the output tables showing a preview of the data processed, and a new tool bar displays on the top left hand corner of the Map Editor.

- Click
to display the data preview of the previous row, within a limit of five rows back.
- Click
to display the data preview of the next row.
- Click
to display the data preview of the next breakpoint.
Information noteNote: To monitor your data processing at a breakpoint you first need to define one on the relevant link. To do so, right-click the relevant link on the design workspace, select Show Breakpoint Setup on the popup menu and select the Activate conditional breakpoint check box and set the Conditions in the table. A pause icon displays below the link when you access the Traces Debug mode. - Click
to stop the data processing.
To deactivate the data preview in the Map Editor:
-
Click OK to close the Map Editor.
-
Go back to the Run view and click the Basic Run tab.
-
Double-click tMap on the design workspace to open the Map Editor.
