From the Jenkins home page, select the
Talend_Simple_Pipeline pipeline.
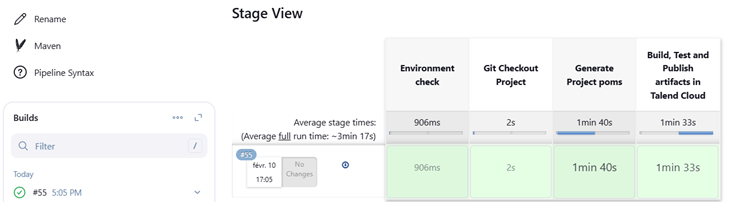
Click Build Now.
Results
The pipeline is executed stage by stage according to what has
been defined in the pipeline script.
If the build is successful, you can go and check the published artifacts:
in Jenkins: the detail of your results can be found in the logs that you can
display by clicking Console Output.
Example where you can
see the successful execution of the test named
test_feature903:
in Talend Management Console
(Talend Cloud
publication):
Example of Job and Route artifacts with version
0.1.0 deployed in the
ci-workspace workspace of the
dev-ci environment:
The option to display Git information (author, commit ID, commit date) in
Talend Management Console
when publishing artifacts using Continuous Integration builds is available from
version 8.0.1 onwards (available from R2022-01).
in your artifact repository: example of Job and Route artifacts with version
0.1.0 deployed in the Nexus
maven-releases repository with an
org.talend.ci Group ID:
in your Docker registry: example of Job artifacts with version
0.1 and latest pushed to a Docker
image called ci_image:
If one of the stages is not successful, the build will fail. Check the logs,
and edit the pipeline configuration if you need to fix some issues.
Information noteTip: To identify the issue more clearly in case of a failed
pipeline:
Execute the pipeline step by step by commenting out other steps
temporarily.
Add debug print statements or log additional variable values to understand
what is happening.
Use the -X parameter with the mvn
command (e.g., mvn -X) to enable detailed Maven debug
output.