Working with the quality bar
The quickest way to identify incorrect data is to look at the quality bar.
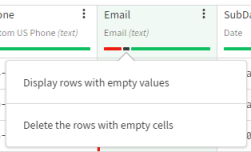
Under each column is a quality bar that displays the number of fields that have correct data, incorrect data or empty fields. Each category is represented by a color:
- Green for data that matches the cell format
- Grey for empty cells
- Red for data that does not match the cell format
Click any color to select, delete, or clear the cells with data in an invalid format. Hovering over the colors allows you to display the exact number of lines for each category, as well as the percentage it represents in a column.
By looking at the quality bar under in the Email column header, you can see that there are empty cells and incorrect values among the data. You are going to remove them.

To use the quality bar to remove the lines containing those incorrect cells, proceed as follows:


