Filter Pane
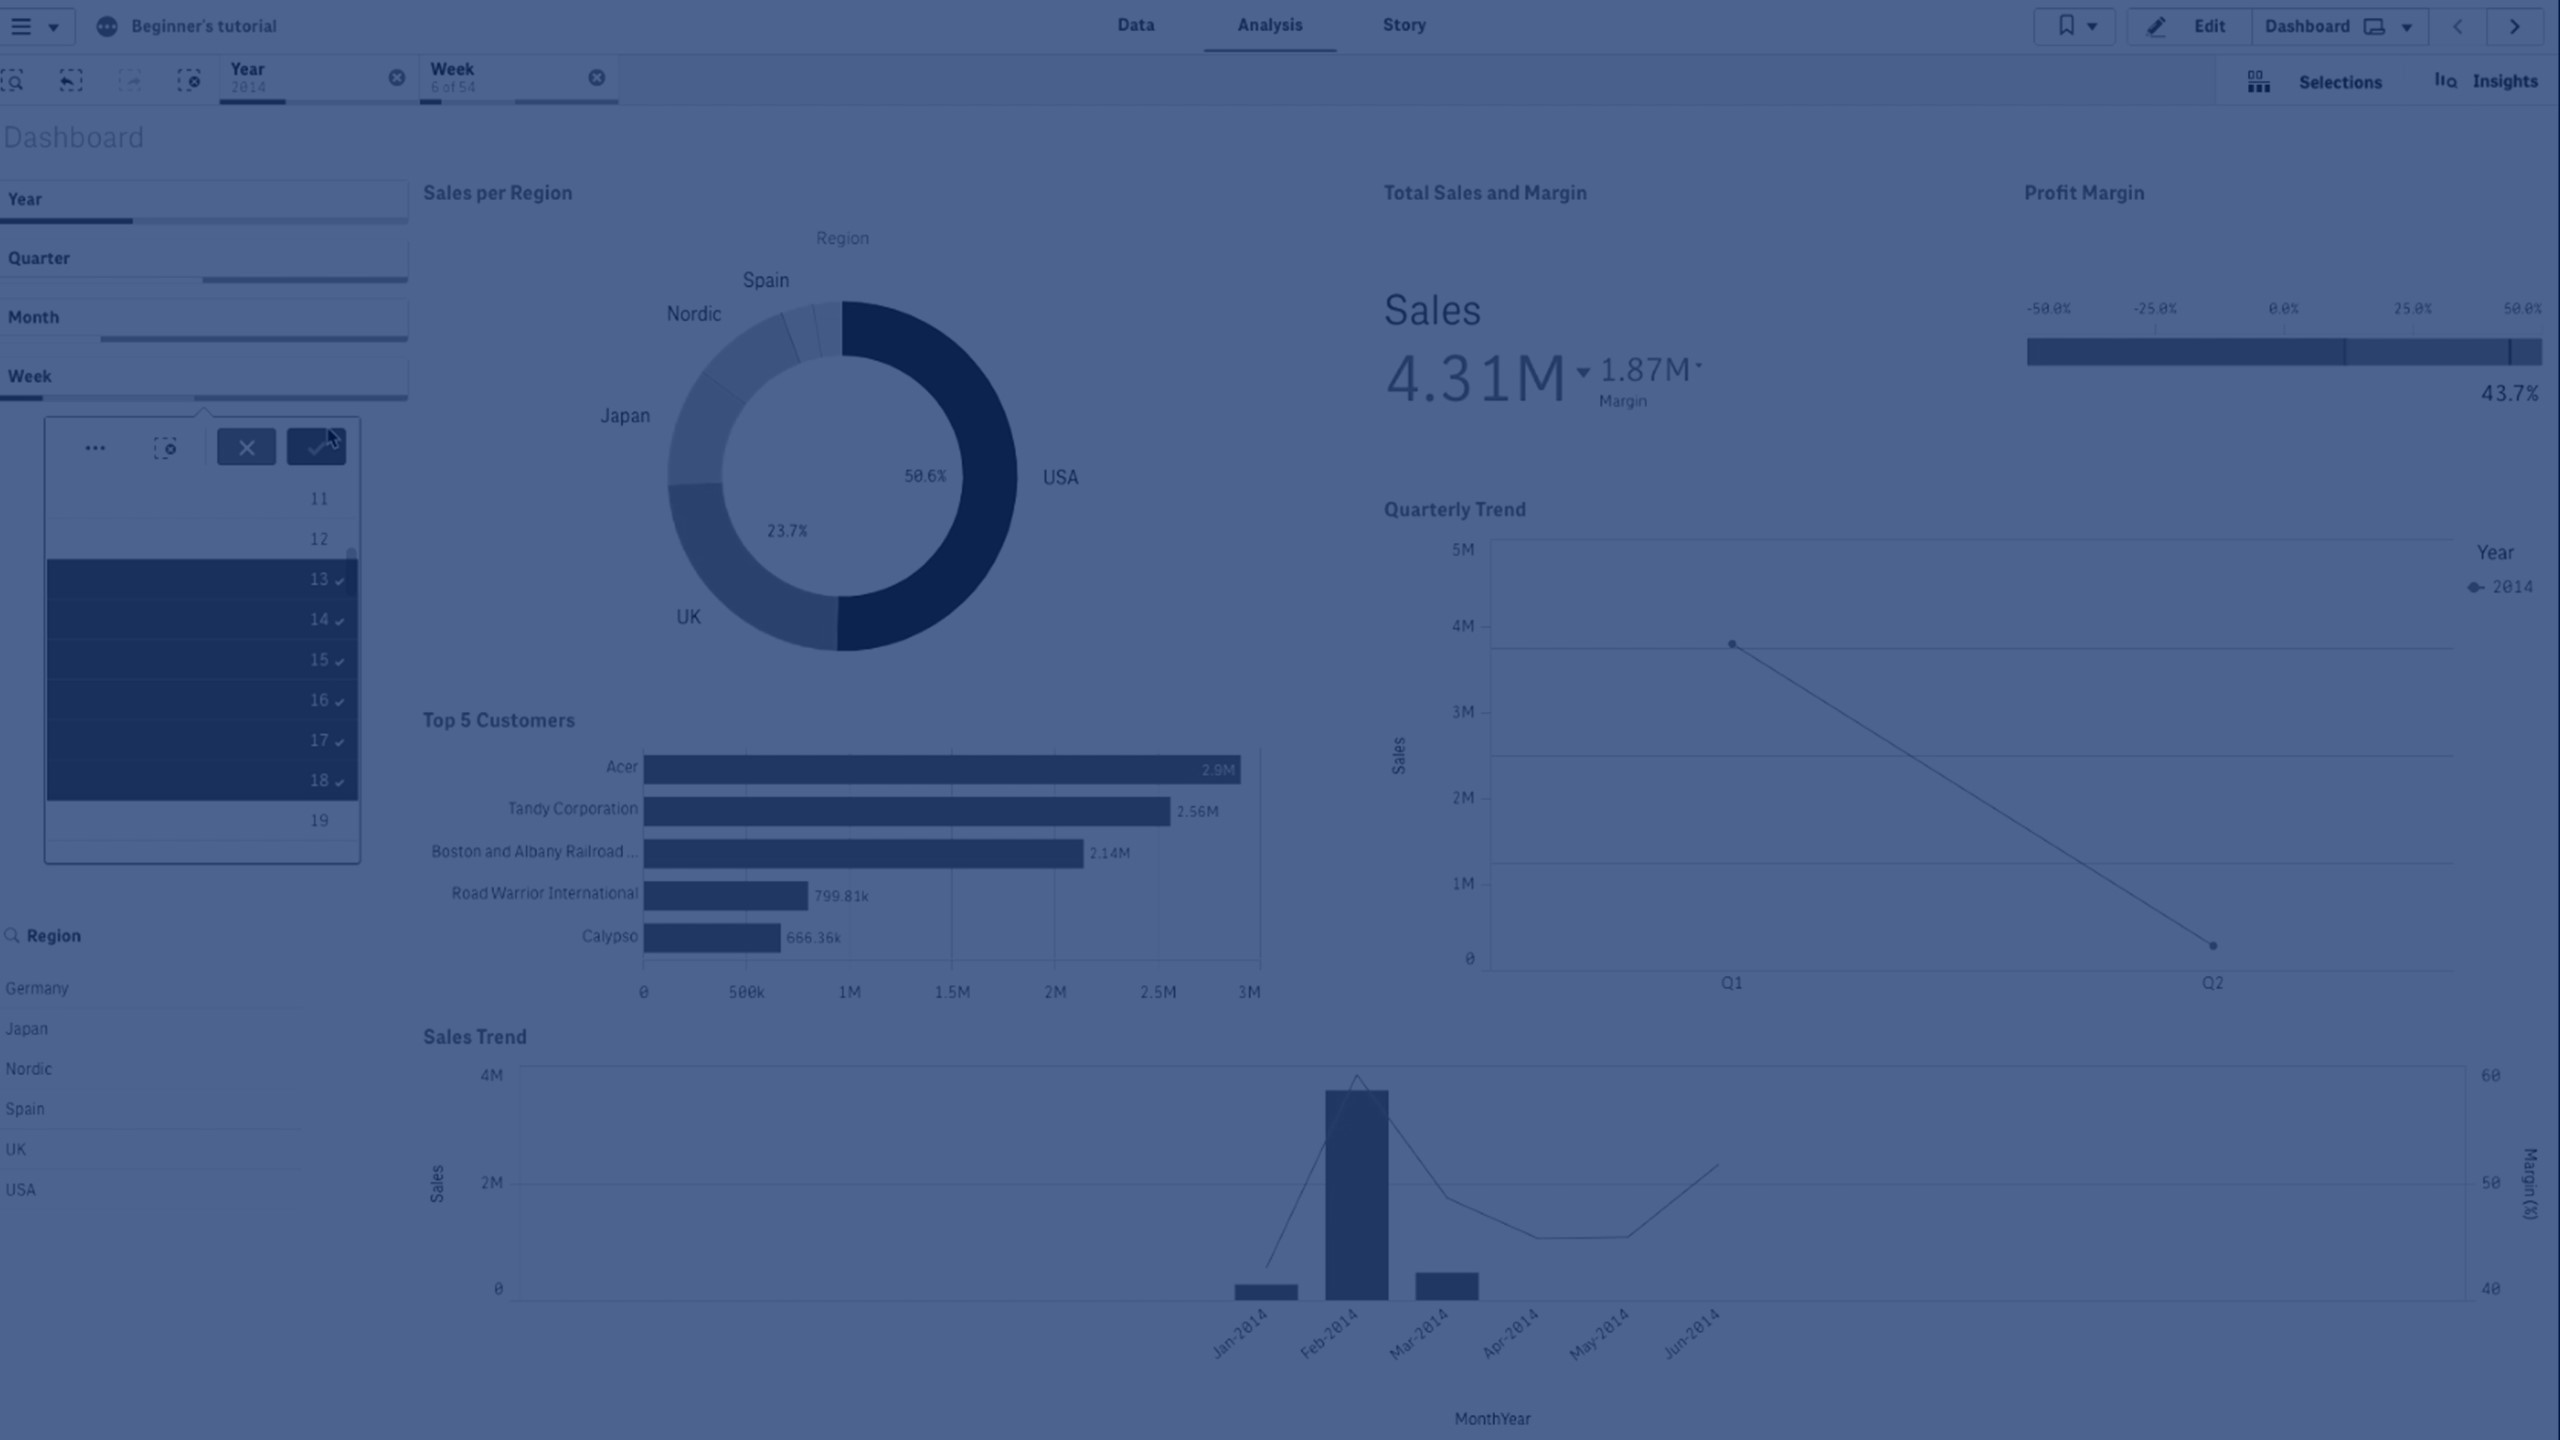
You can add a filter pane to control what data that is shown in the visualizations on a sheet. A filter pane can filter the data of several dimensions at once. For example, if you have a chart of sales over time, you can use a filter pane to limit the data in the chart to only show sales from a selected time period, from certain product categories, and from a certain region.