Creating a drill-down layers in map charts
In this video, you’ll learn how to create drill-down maps in Qlik Sense. Drill-down dimensions let you display geographical data at multiple levels, such as Region → City, ensuring that users see only the most relevant details as they interact with your map.
We’ll cover how to:
- Build a drill-down dimension in Master Items
- Configure area and point layers for different levels of detail
- Apply colors and measures for better insights
- Navigate between regions and cities interactively
Perfect for anyone working with location-based analysis in Qlik Sense.
🔹 00:07 — Introduction: Why use drill-down dimensions in maps
🌍 00:17 — Displaying layers at different levels of detail
🗺️ 00:39 — Adding a Map chart to the sheet
📐 00:42 — Creating a drill-down dimension
📊 00:52 — Choosing dimensions (Region → City)
🗂️ 01:01 — Adding the drill-down dimension to the area layer
🎨 01:13 — Coloring by measure (Sales)
📍 01:24 — Setting visible drill-down levels to Region
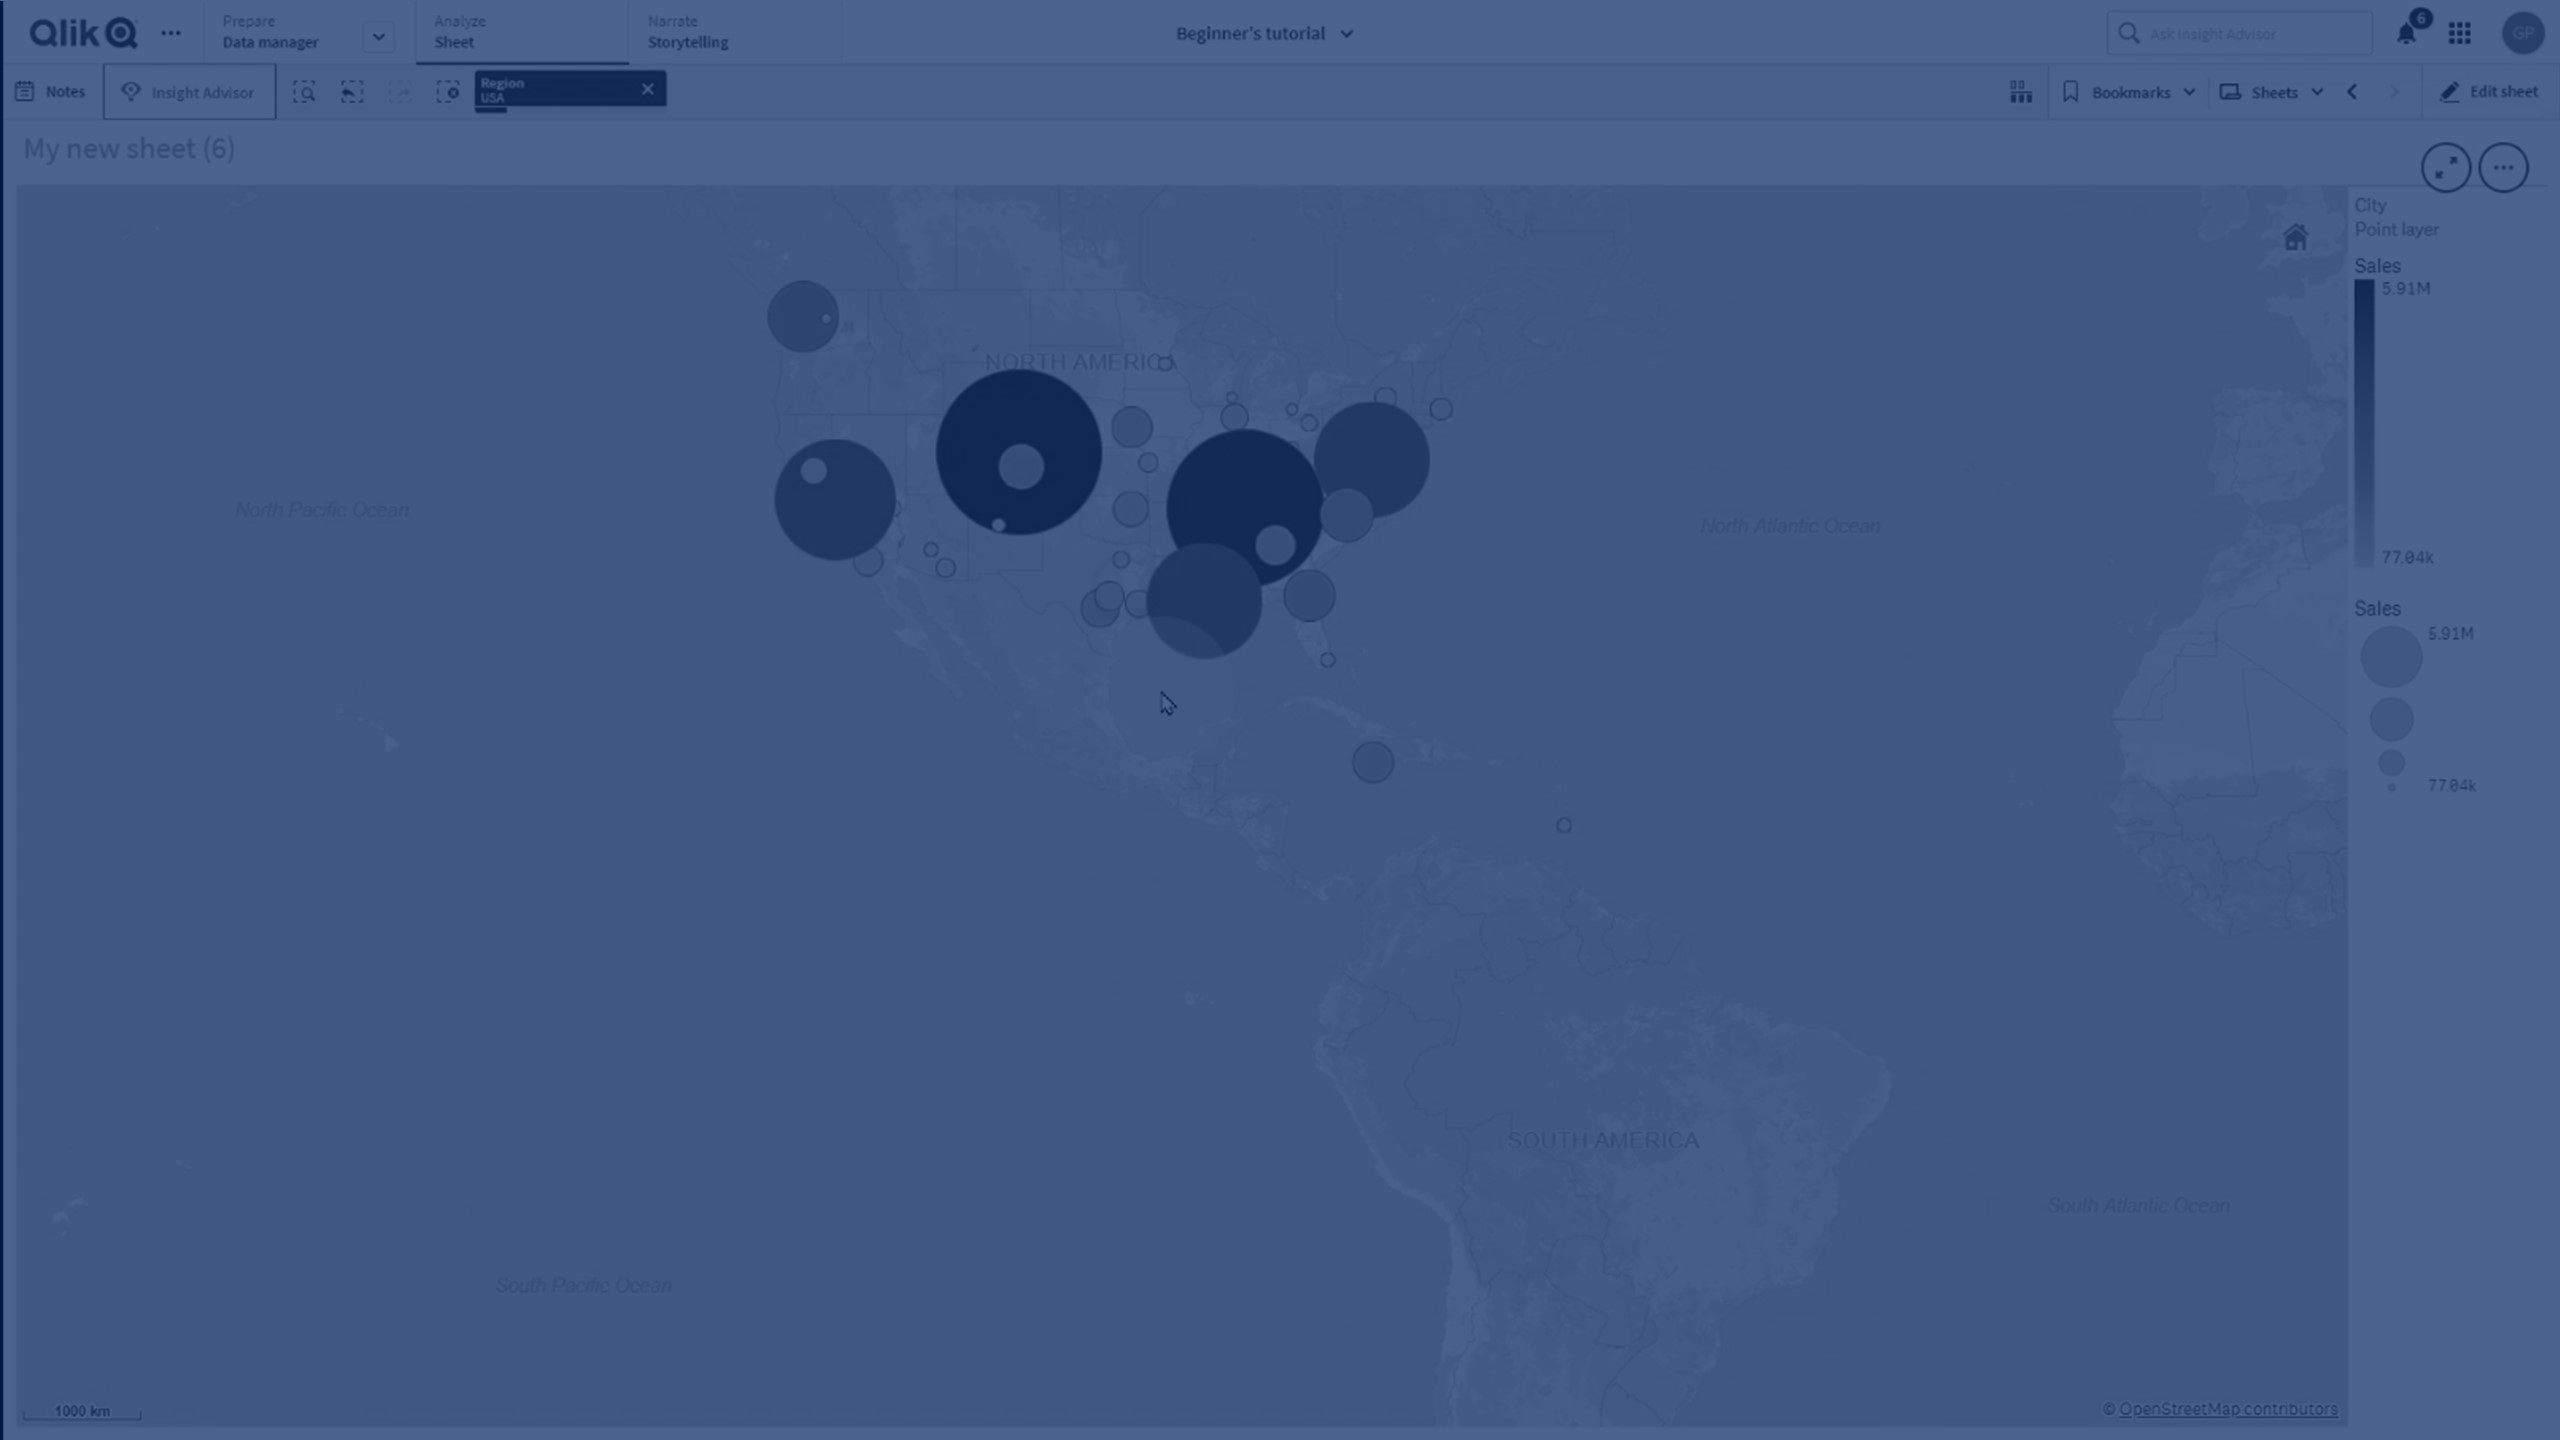
➕ 01:34 — Adding the point layer for City level
🏙️ 01:45 — Setting visible drill-down levels to City
🎨 01:55 — Coloring and formatting the point layer
⚖️ 02:07 — Adjusting point size and shape
🧭 02:16 — Testing drill-down: navigating Region → City
🌐 02:30 — Example: Selecting a region to reveal its cities
✅ 02:32 — Conclusion