Adding custom analyses to Insight Advisor
You can define specific analyses to be used for certain terms. This helps you control what analyses users receive in Insight Advisor and create preferred analyses.
With custom analyses, you can define the response for specific terms and control the analyses returned by Insight Advisor. You can define multiple terms for a custom analysis. You can also define different terms in different languages for a custom analysis.
In Qlik Sense Client-Managed, vocabularies are only supported in English.
Custom analysis

When you create a custom analysis, you add terms to the analysis and then select the analysis type. You can then specify default dimensions or measures. When no defaults are set, Insight Advisor determines the appropriate dimensions or measures to use in the analysis based on the user's question.
Optionally, you can set constraints on your analysis type, to limit the scope. For example, you may want only values that exceed a certain measure value to be included in the analysis.
You can optionally choose the chart type to use in your analysis from those available to your analysis type. If you select a chart type, the custom analysis will always use that chart type unless it determines another chart is more appropriate for the selected data. You can choose to enforce your chart so that only that chart type will be used, even if there are more appropriate charts for the question. For example, you can enforce a pie chart. If a search uses a dimension that contains 200 distinct values, the pie chart will be used even if it is not the optimal chart for the data.
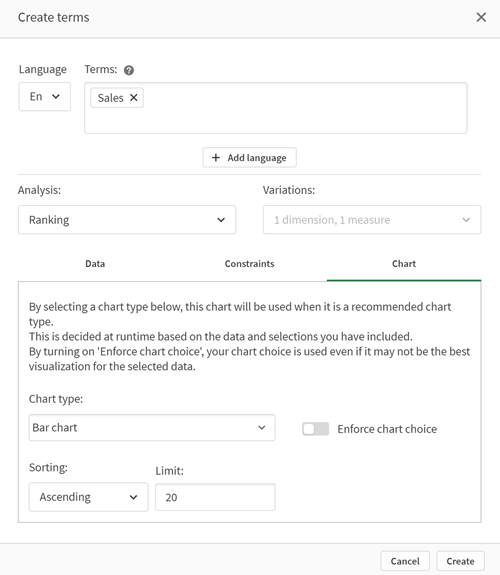
Some analysis types also let you set sorting options for the chart and optionally apply limits for how many values are displayed. For example, you could configure a custom analysis with the Ranking analysis type, sorted by ascending values and with a limit of 20 dimension values shown. The image below shows how this can be set up.
Custom analysis dialog with options for chart sorting

Analysis types
The following table outlines the analysis types available when making custom analyses. Some analyses have different variations from which to choose. These determine what kind of field are used in the analysis.
| Analysis type | Use | Variations |
|---|---|---|
| Breakdown | Break down a measure by multiple dimensions. | 2-3 dimensions, 1 measure |
| Breakdown (geospatial) | Group data by simple and hierarchical geographic divisions. | 1-2 geographic dimensions, 0-2 measures |
| Calculated measure (KPI) | Display aggregated totals. | 1 measure |
| Clustering (k-means) | Compare 2 measures over a dimension by clustering the results using the KMeans2D function. | 1 dimension, 2 measures |
| Comparison |
Compare two to four measures over one or two dimensions. Two variations are supported:
|
1 dimension, 2-4 measures 2 dimensions, 2-3 measures |
| Correlation | Show the relative correlation between 2 measures over up to 2 optional dimensions. | 0-2 dimensions, 2 measures |
| Mutual information |
Display the statistical dependency between the target and the selected items. The dependency indicator ranges between 0% (no dependency) and 100% (strong dependency). You can select one field (measure or dimension) as the target and then select 1-10 dimensions or measures as drivers. Mutual information uses a randomly selected sample of data. Results for this analysis type for the same fields or selections may vary as a result. |
2-11 fields |
| Overview | Show the overview of a measure with multiple dimensions. | 1-2 dimensions, 1 measure |
| Period over period | Compare a measure over the current period versus the previous period. | 1 measure |
| Process control (mean) | Show an indication of a measure's performance between two calculated control limits. | 1 measure, 1 temporal dimension |
| Process control (rolling mean) | Show an indication of a measure's performance between two calculated control limits over the last seven periods. | 1 measure, 1 temporal dimension |
|
Ranking |
Rank dimension values by a measure, with optional grouping. | 1 dimension, 1 measure |
|
Ranking (grouped) |
Show the nested ranking of one or more dimensions against a measure over time. | 3 dimensions, 1 measure |
| Relative importance | Create a rank with cumulative contribution (Pareto chart). | 1 dimension, 1 measure |
|
Trend over time |
Show the performance of a measure over time, optionally broken down by a dimension with low cardinality. Two variations are supported:
|
0-1 dimension, 1 measure, 1 temporal dimension 2-3 measures, 1 temporal dimension |
|
Year to date |
Break down a measure (with results from this year and last year) by a dimension. | 1 dimension, 1 measure, 1 temporal dimension |
Creating custom analyses
Do the following:
- In an app, click Prepare and select Vocabulary.
- Click Custom analysis.
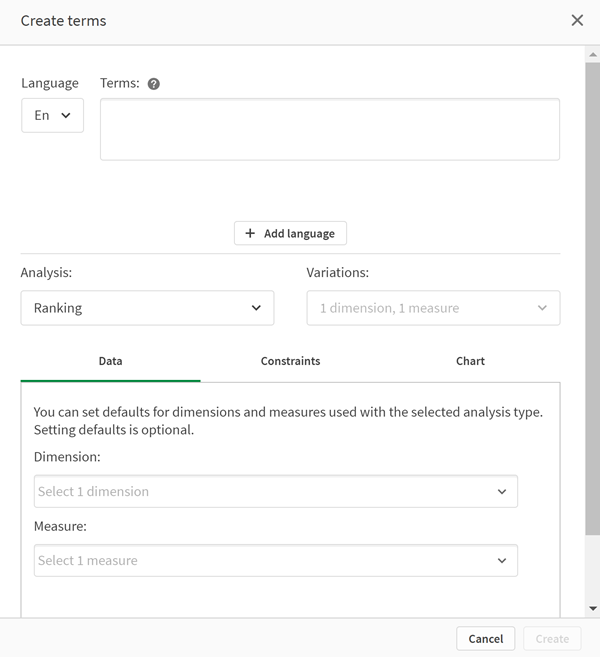
- Click Create terms.
- Select a language from the language drop-down and enter the terms for your custom analysis.
- Optionally, add another language and add the terms for that language.
- From Analysis type, select your analysis type.
- If available, select the variation to use.
- If you want to specify the dimensions and measures for the analysis. in Data, select the default fields to use.
- If you want to apply constraints to the analysis, in Constraints, select a field, condition, and value.
-
In Chart, under Chart type, optionally select the primary chart to use with your custom analysis.
To use this chart type even when other charts might be more appropriate, select Enforce chart choice.
- If available for your analysis type, set the sorting and limit for the chart.
- Click Create.
- If your app is available for Insight Advisor Chat, click the app name in the navigation bar and turn Insight Advisor in hub off then on.
Limitations
Custom analyses have the following limitations:
-
The setting Enforce chart choice is not followed in the following scenarios:
-
When an unsupported number of fields are added to the custom analysis than the selected chart type supports.
For example, some charts support two dimensions, but not three dimensions. If you create a breakdown analysis with two dimensions and enforce the mekko chart, that functions as expected. If you create a breakdown analysis with three dimensions and select the mekko chart, the mekko chart will not be used as it does not support three dimensions.
-
When a user adds a constraint on a dimension that causes the limit of dimensions to be exceeded.
For example, you create a breakdown analysis with the dimensions category and product and select and enforce a mekko chart. This works as expected. If you add a constraint on the dimension country, there are now three dimensions being used in the chart, so the mekko chart will not be enforced.
-
When a variance waterfall chart is selected, but there are no calendar periods applied.
-
-
Constraints are not available with all analysis types.
-
In Insight Advisor Chat, follow-up questions do not work with custom analyses. For example, if you ask sales summary, a custom analysis, and then ask a follow up question, such as what about profit, Insight Advisor Chat will treat it as a new question.
-
Fields tagged $hidden in the load script will not be available in custom analysis, even if they are set to visible in the logical model.
