
Lasso selection
When you want to make a draw or lasso selection, you must first click inside the visualization and turn on lasso selection by clicking the lasso icon ![]() at the top of the visualization. On a computer, you can also press Shift and make the selection.
at the top of the visualization. On a computer, you can also press Shift and make the selection.
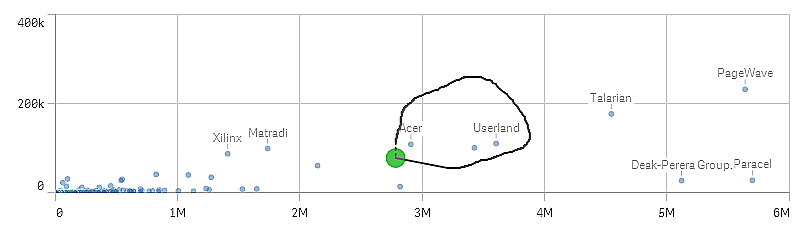
You draw a freehand circle to capture and select data points.
Selection of values made in a scatter plot using lasso selection.
Your lasso selections only include visible data points. For charts using a continuous axis, data points not visible in the chart will be excluded, even if they are within the area being selected.