Draw selection
When you want to make a draw or lasso selection, you must first click inside the visualization and turn on lasso selection by clicking the lasso icon ![]() at the top of the visualization. On a computer, you can also press Shift and make the selection.
at the top of the visualization. On a computer, you can also press Shift and make the selection.
You draw a freehand line to select several values/data points at a time. You cannot draw to deselect values/data points.
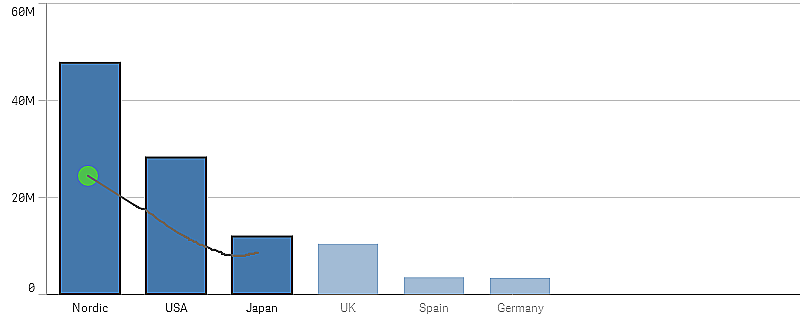
Bar chart with selections Nordic, USA and Japan made with draw selection.
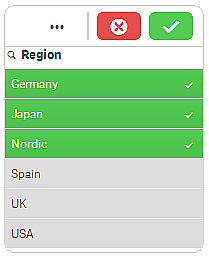
In a table or a filter pane, you draw across several values to select them.
Filter pane with selections Germany, Japan and Nordic made with draw selection.
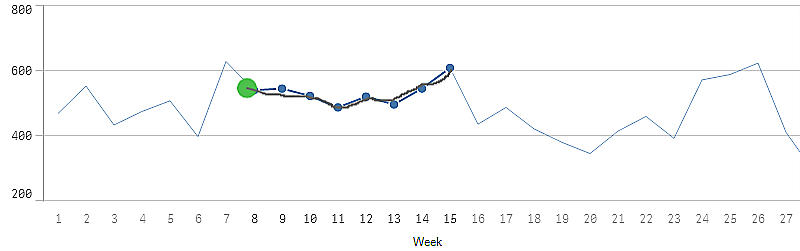
In a line chart you draw along a line to select a number of data points.
Line chart with weeks selected with draw selection.
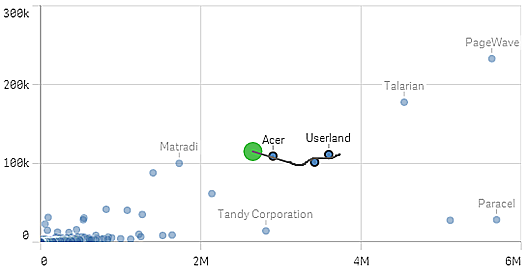
In a scatter plot you draw across a number of data points to select them.
Scatter plot with selections made with draw selection.