
Color by expression
Coloring by expression sets colors using a user-defined expression. When coloring by expression, you can define both what colors to use and which values to use them with, enabling more control over how colors are used in the visualization.
For example, you might highlight values of particular interest, or differentiate between values within different value ranges. Coloring by expression can also be used to color a visualization by values not included within a visualization, such as coloring products and the sum of their monthly sales by the country of origin for the product.
When you select to color By expression, you can choose to either use the expression as a color code or to define how By measure color options are applied to the visualization using an expression.
The following visualizations support color by expression:
- Bar chart
- Combo chart
- KPI chart
- Line chart
- Map
- Pie chart
-
Pivot table
- Scatter plot
-
Table
- Treemap
You can also use color by expression to set a background color on a sheet. For more information, see Structuring an app using sheets.
Coloring by expression as a color code
By default, if you choose to color by expression, The expression is a color code is enabled. If you have this option selected, your expression must include a color code in a supported expression format to define the colors to use. Using this method provides you with manual control over visualization colors as well as the conditions for the colors being used in a visualization. With tables and pivot tables, you can use expressions to define the background color and the text color of columns.
Examples
Here are a few examples to show what you can do with expressions by color.
Example: Coloring by random color range
argb(255,rand()*255,rand()*255,rand()*255)
This example uses ARGB color. It starts with alpha value that sets full opacity, and then uses the rand() function to generate random values for the red, green, and blue colors, creating a random color.
Example: Coloring by single measure value
if(sum([Budget Amount]) > 1000000, 'cornflowerblue', magenta())
In this example, there is a condition. If sum([Budget Amount]) is greater than 1 million, the corresponding measure values will be colored 'cornflowerblue', otherwise they will be colored magenta.
'cornflowerblue' is the color keyword for the color rgb(100, 149, 227).
magenta() is the Qlik Sense color function that generates a magenta color.
Example: Coloring by single measure value using an aggregated expression
if(avg(Value) > avg(Total aggr(avg(Value), Name)), Blue(), Brown())
In this example, there is a condition. If the avg(Value) value is greater than the aggregated avg(Value) value of the entire table, then the corresponding measure value is colored blue. If the avg(Value) value is less than the aggregated avg(Value) value of the entire table, then the corresponding measure value is colored brown.
Example: Coloring by multiple measure values
if(Sum(Sales) > 3000000, 'green', if(Sum(Sales) > 2000000, 'yellow', if(Sum(Sales) > 1000000, 'orange', red())))
In this example, there are multiple conditions. If Sum(Sales) is greater than 3,000,000, then corresponding measure values will be colored green. If Sum(Sales) is between 2,000,000 and 3,000,000, then the corresponding measure values will be colored yellow. If Sum(Sales) is between 1,000,000 and 2,000,000, the corresponding measure values will be colored orange. All other measure values will be colored red.
Example: Coloring by multiple dimensions
if([CompanyName]= 'A Corp', rgb(100, 149, 227), if([CompanyName]= 'B Corp', rgb(100, 149, 200), if([CompanyName]= 'C Corp', rgb(100, 149, 175), if([CompanyName]= 'D Corp', rgb(100, 149, 150), 'grey'))))
In this example, the expression is used to define a RGB color for each specific dimension value in the field CompanyName.
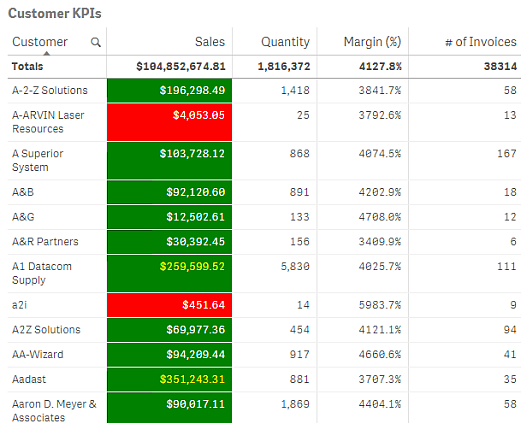
Example: Coloring table object font and background by measure value.
if(Sum([Sales]) < 10000, 'red', green())
if(Sum([Sales]) > 200000, 'gold', )
In this example, two expressions are used to color the background and text of the Sales column. Measure values in Sales that are lower than $10000 have a red background color, all other values have a green background. In addition, the values that are higher than $200000 have the text color 'gold'.
Coloring by expression without a color code
You can color by expression without a color by disabling The expression is a color code when you enable coloring by expression. In this method of coloring, the expression is used to evaluate to a numeric value that is plotted against a By measure chart gradient, treating the expression like a measure when coloring by measure.
Example:
100*Sum([Sales Margin Amount])/Sum([Sales Amount])
In this example, charts would have By measure color gradients applied to them based on the profit margin percentile calculated in the expression.
Supported expression formats
The following formats are supported when you create your expressions.
RGB
With RGB colors you enter an integer value between 0 and 255 (or an expression that evaluates to such a value) for each of the colors red, green, and blue. The resulting color is produced by adding the three colors together.
Example:
rgb(0,0,255)
This example generates the color blue. Many of the RGB colors have a corresponding keyword in plain text that can be used instead of the RGB code. If you use 'blue' as expression, you would get exactly the same color. Hexadecimal numbers are also supported, and the color blue has the string '#0000ff'.
ARGB
The ARGB color model has the same support as the RGB color model, but extends it with an additional alpha value to set the opacity of a color.
Example:
argb(125,0,0,255)
The first value (125), sets the alpha value. The value 0 generates full transparency and the value 255 full opacity.
HSL
In HSL, the color is defined by a hue value, a saturation value, and a luminosity value. You use values between 0 and 1. Hue is represented as an angle of the color circle (that is, the rainbow represented in a circle). Saturation is full with the value 1 and a shade of gray with the value 0. Lightness with the value 1 is white, and black with the value 0. The value 0.5 is commonly used.
Example:
hsl(0,0.5,0.5)
This example generates a red color with medium saturation and lightness.
Color keywords
Qlik Sense supports W3C recommended color keywords. With color keywords, specific colors are defined by a name which corresponds to a RGB hex value. Enter the color name in the expression to use the color.
Use the following links to find out more about W3C color keywords:
http://www.w3.org/TR/CSS21/syndata.html#value-def-color
https://developer.mozilla.org/en-US/docs/Web/CSS/color_value
Example:
'cornflowerblue'
This example generates a blue color with the hex value of #6495ed and a RGB value of (100, 149, 237).
Qlik Sense color functions
The following color functions can be used in expressions when coloring by expression.
- black()
- darkgray()
- lightgray()
- white()
- blue()
- lightblue()
- green()
- lightgreen()
- cyan()
- lightcyan()
- red()
- lightred()
- magenta()
- lightmagenta()
- brown()
- yellow()
Creating an expression
You create expressions for colors in the properties panel.
Do the following:
-
In the properties panel, open Appearance > Colors and legend.
-
Click the Colors button to switch to Custom.
-
In the drop-down list, select the option By expression.
An expression text box is opened.
-
Enter your expression in the text box, or click
 to open the expression editor.
If the expression is valid, the visualization is updated.