
Debugging using web developer tools
Historically, JavaScript developers have often used alert() for debugging purposes but this can be perceived as annoying so it is recommended to use console.log() to send data to the browser console instead.
Web developer tools
Most web browsers offer some sort of developer tool but in this section will introduce some basic concepts based on Google Chrome.
Developer tools from your favorite browser
If you are developing your visualization extensions using Qlik Sense Desktop, you can still use your favorite browser for debugging purposes. Simply open Qlik Sense Desktop and leave it open. Then open your favorite browser and navigate to http://localhost:4848. This will display the Hub and from there you can open the browser's developer tools.
Developer tools from Qlik Sense Desktop
Since Qlik Sense Desktop is using Chromium as an embedded browser, you can access the Chrome DevTools from Qlik Sense Desktop. Press Ctrl + Shift and at the same time right click with the mouse on the sheet and then select Show DevTools from the dialog.
Debugging using Chrome DevTools
This section highlights three areas that are highly relevant when developing visualization extensions:
- Using the console
- Inspect elements
- Debugging
Using the console
As mentioned above, it is more convenient to use the console of web DevTools instead of triggering alerts. To do so, use console.info or console.log to push something to the console.
Example:
paint: function ( $element, layout ) {
var err = {
message: 'Something went wrong',
errCode: 'bla'
};
console.info( 'We are re-painting the extension' );
console.error( 'Oops, we haven an error', err );
console.log( 'We are here' );
console.log( 'layout', layout );
}It is recommended that you spend some time observing more advanced concepts of the console, like:
console.assert()
console.group()
console.groupCollapsed()
console.groupEnd()
console.table()Considerations
The console.xyz() functions are not supported by all web browsers and therefore it is recommended that you ensure there are no console.xyz() remaining in the code when it reaches the production environment. There are several strategies to achieve this:
- Manually remove all console.xyz() from the code before deploying to the production environment.
- Wrap all your calls to the console so that they are only executed if the current web browser supports console calls.
- Use tools, for example Grunt or Gulp, to create a deployment process where all console statements are removed automatically.
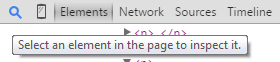
Inspect elements
Document Object Model (DOM) manipulation can be reviewed using an inspector which is a common capability of most web developer tools. In Chrome DevTools you access the inspect elements function by clicking the magnifying glass in the toolbar.
Debugging
You can use developer tools for live debugging, for example:
- Chrome DevTools
- Firebug