Creating distribution plots ON THIS PAGE This section describes how to create distribution plots with the Visualization API and qlik-visual.
Creating a basic distribution plot
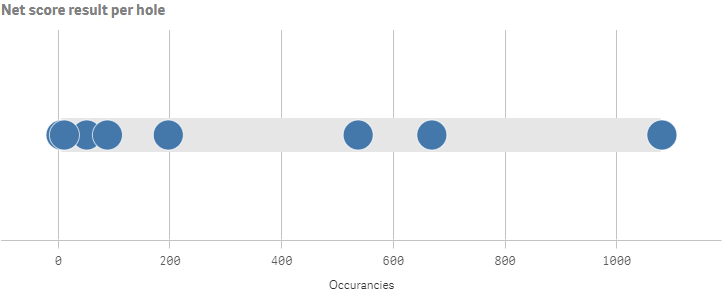
In this example we want to create a basic distribution plot, containing one dimension and two measures, with a custom title and horizontal orientation.
Create the chartCreate the container for the chart. The visualization type is distributionplot .
Visualization API
app.visualization.create(
  'distributionplot',
  [],
  {}
)
qlik-visual
<qlik-visual appid="Tutorial-Golf.qvf"
  type="distributionplot"
  cols='[]'
  options='{}' >
</qlik-visual>
Define the dimensionDefine the dimension as a column.
[
{
"qDef": {
"qFieldDefs": [
"=NetScoreName"
],
"qFieldLabels": [
"Net result"
]
},
"qNullSuppression": true
}
]
Define measuresDefine the measures as columns.
[
{
"qDef": {
"qFieldDefs": [
"=NetScoreName"
],
"qFieldLabels": [
"Net result"
]
},
"qNullSuppression": true
},
{
"qDef": {
"qLabel": "Occurancies",
"qDef": "Count(HoID)",
"qNumFormat": {
"qType": "F",
"qnDec": 2,
"qUseThou": 0
}
}
}
]
Define the title in the optionsThen define the title and the orientation in the options.
{
"showTitles": true,
"title": "Net score result per hole"
}
Result
Code examples
Visualization API
app.visualization.create(
  'distributionplot',
  [
    {
      "qDef": {
        "qFieldDefs": [
          "=NetScoreName"
        ],
        "qFieldLabels": [
          "Net result"
        ]
      },
      "qNullSuppression": true
    },
    {
      "qDef": {
        "qLabel": "Occurancies",
        "qDef": "Count(HoID)",
        "qNumFormat": {
          "qType": "F",
          "qnDec": 2,
          "qUseThou": 0
        }
      }
    }
  ],
  {
    "showTitles": true,
    "title": "Net score result per hole"
  }
).then(function(vis){
  vis.show("QV01");
});
qlik-visual
<qlik-visual appid="Tutorial-Golf.qvf"
  type="distributionplot"
  cols='[
    {
      "qDef": {
        "qFieldDefs": [
          "=NetScoreName"
        ],
        "qFieldLabels": [
          "Net result"
        ]
      },
      "qNullSuppression": true
    },
    {
      "qDef": {
        "qLabel": "Occurancies",
        "qDef": "Count(HoID)",
        "qNumFormat": {
          "qType": "F",
          "qnDec": 2,
          "qUseThou": 0
        }
      }
    }
  ]'
  options='{
    "showTitles": true,
    "title": "Net score result per hole"
  }' >
</qlik-visual>
Presentation and color settings
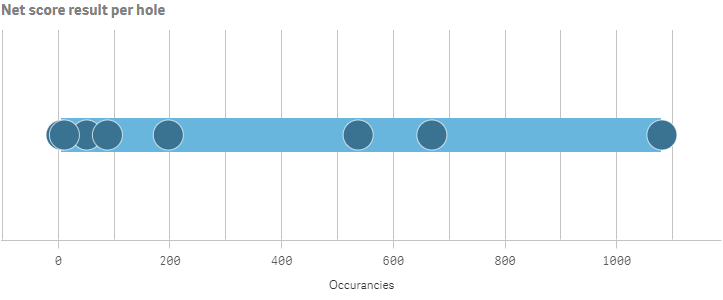
In the example we change the way the distribution plot is presented by adding narrow grid line spacing and customizing the colors. All these changes are set in the options.
Add narrow grid line spacingChanges to the grid line spacing is set in the gridlines object. Disable auto grid lines and set spacing to 3 which means narrow.
"gridlines": {
"auto": false,
"spacing": 3
}
Add custom colors to the chartYou can set the presentation colors of the distribution plot: box color and point color. They are defined in the color object and each array consists of a paletteColor definition where you set the actual color as an index number in the palette or as a HEX string color.
This example use colors that are not in the default palette, defined by "index": -1 . The box color is a lighter shade of blue ("color": "#68b5de" ) while the point color is a darker shade of blue ("color": "#3a7391" ).
"color": {
"box": {
"paletteColor": {
"index": -1,
"color": "#68b5de"
}
},
"point": {
"paletteColor": {
"index": -1,
"color": "#3a7391"
}
}
}
Result
Code examples
Visualization API
app.visualization.create(
  'distributionplot',
  [
    {
      "qDef": {
        "qFieldDefs": [
          "=NetScoreName"
        ],
        "qFieldLabels": [
          "Net result"
        ]
      },
      "qNullSuppression": true
    },
    {
      "qDef": {
        "qLabel": "Occurancies",
        "qDef": "Count(HoID)",
        "qNumFormat": {
          "qType": "F",
          "qnDec": 2,
          "qUseThou": 0
        }
      }
    }
  ],
  {
    "showTitles": true,
    "title": "Net score result per hole",
    "gridlines": {
      "auto": false,
      "spacing": 3
    },
    "color": {
      "box": {
        "paletteColor": {
          "index": -1,
          "color": "#68b5de"
        }
      },
      "point": {
        "paletteColor": {
          "index": -1,
          "color": "#3a7391"
        }
      }
    }
  }
).then(function(vis){
  vis.show("QV01");
});
qlik-visual
<qlik-visual appid="Tutorial-Golf.qvf"
  type="distributionplot"
  cols='[
    {
      "qDef": {
        "qFieldDefs": [
          "=NetScoreName"
        ],
        "qFieldLabels": [
          "Net result"
        ]
      },
      "qNullSuppression": true
    },
    {
      "qDef": {
        "qLabel": "Occurancies",
        "qDef": "Count(HoID)",
        "qNumFormat": {
          "qType": "F",
          "qnDec": 2,
          "qUseThou": 0
        }
      }
    }
  ]'
  options='{
    "showTitles": true,
    "title": "Net score result per hole",
    "gridlines": {
      "auto": false,
      "spacing": 3
    },
    "color": {
      "box": {
        "paletteColor": {
          "index": -1,
          "color": "#68b5de"
        }
      },
      "point": {
        "paletteColor": {
          "index": -1,
          "color": "#3a7391"
        }
      }
    }
  }' >
</qlik-visual>
Dimension and measure axis settings
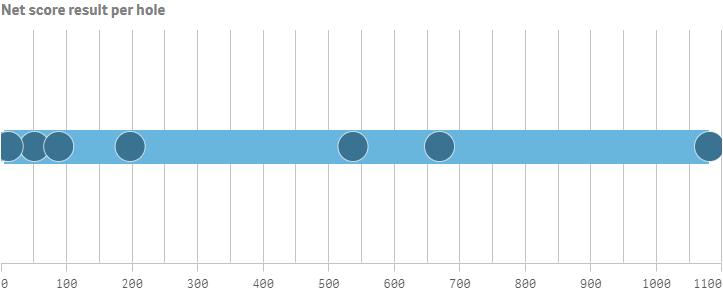
In this example we define how the measure axis is presented. This is set in the measureAxis object. If more than one dimension is used, the dimension axis settings are defined in the dimensionAxis object. This example display labels only on the measure axis . The axis also has narrow spacing and a custom range. The visualization consists of only one dimension so no dimension axis settings are needed.
Labels and spacingSet to display labels only on the measure axis: "show": "labels" .
Define that narrow spacing should be used: "spacing": 0.5 .
"measureAxis": {
"show": "labels",
"dock": "near",
"spacing": 0.5
}
Customize the rangeEnable custom range by setting "autoMinMax": false . Set the mode to display Max: "minMax": "minMax" and then define the minimum and maximum values (0 and 1200 ).
"measureAxis": {
"show": "labels",
"dock": "near",
"spacing": 0.5,
"autoMinMax": false,
"minMax": "minMax",
"min": 0,
"max": 1100
}
Result
Code examples
Visualization API
app.visualization.create(
  'distributionplot',
  [
    {
      "qDef": {
        "qFieldDefs": [
          "=NetScoreName"
        ],
        "qFieldLabels": [
          "Net result"
        ]
      },
      "qNullSuppression": true
    },
    {
      "qDef": {
        "qLabel": "Occurancies",
        "qDef": "Count(HoID)",
        "qNumFormat": {
          "qType": "F",
          "qnDec": 2,
          "qUseThou": 0
        }
      }
    }
  ],
  {
    "showTitles": true,
    "title": "Net score result per hole",
    "gridlines": {
      "auto": false,
      "spacing": 3
    },
    "color": {
      "box": {
        "paletteColor": {
          "index": -1,
          "color": "#68b5de"
        }
      },
      "point": {
        "paletteColor": {
          "index": -1,
          "color": "#3a7391"
        }
      }
    },
    "measureAxis": {
      "show": "labels",
      "dock": "near",
      "spacing": 0.5,
      "autoMinMax": false,
      "minMax": "minMax",
      "min": 0,
      "max": 1100
    }
  }
).then(function(vis){
  vis.show("QV01");
});
qlik-visual
<qlik-visual appid="Tutorial-Golf.qvf"
  type="distributionplot"
  cols='[
    {
      "qDef": {
        "qFieldDefs": [
          "=NetScoreName"
        ],
        "qFieldLabels": [
          "Net result"
        ]
      },
      "qNullSuppression": true
    },
    {
      "qDef": {
        "qLabel": "Occurancies",
        "qDef": "Count(HoID)",
        "qNumFormat": {
          "qType": "F",
          "qnDec": 2,
          "qUseThou": 0
        }
      }
    }
  ]'
  options='{
    "showTitles": true,
    "title": "Net score result per hole",
    "gridlines": {
      "auto": false,
      "spacing": 3
    },
    "color": {
      "box": {
        "paletteColor": {
          "index": -1,
          "color": "#68b5de"
        }
      },
      "point": {
        "paletteColor": {
          "index": -1,
          "color": "#3a7391"
        }
      }
    },
    "measureAxis": {
      "show": "labels",
      "dock": "near",
      "spacing": 0.5,
      "autoMinMax": false,
      "minMax": "minMax",
      "min": 0,
      "max": 1100
    }
  }' >
</qlik-visual>
Multiple lines using inner and outer dimensions
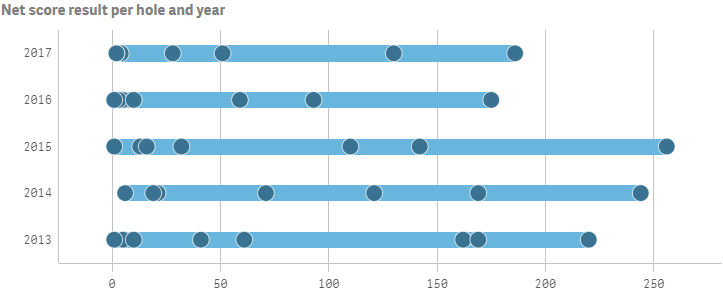
In this example we add a second dimension which gives us one line for each value of the second (or outer) dimension.
Add the outer dimension as a column{
"qDef": {
"qFieldDefs": [
"Date.autoCalendar.Year"
],
"qFieldLabels": [
"Year"
]
},
"qNullSuppression": true
}
Define the dimension axisSince we now have two dimensions we can configure the dimension axis. This example show labels only for the outer dimension.
"dimensionAxis": {
"show": "labels"
}
Add sortingFor distribution plots, sorting is done in the sorting object inside the options. This example is sorted alphabetically in descending order.
"sorting": {
"autoSort": false,
"sortCriteria": {
"sortByAscii": -1,
"sortByLoadOrder": 1
}
}
Result
Code examples
Visualization API
app.visualization.create(
  'distributionplot',
  [
    {
      "qDef": {
        "qFieldDefs": [
          "=NetScoreName"
        ],
        "qFieldLabels": [
          "Net result"
        ]
      },
      "qNullSuppression": true
    },
    {
      "qDef": {
        "qFieldDefs": [
          "Date.autoCalendar.Year"
        ],
        "qFieldLabels": [
          "Year"
        ]
      },
      "qNullSuppression": true
    },
    {
      "qDef": {
        "qLabel": "Occurancies",
        "qDef": "Count(HoID)",
        "qNumFormat": {
          "qType": "F",
          "qnDec": 2,
          "qUseThou": 0
        }
      }
    }
  ],
  {
    "showTitles": true,
    "title": "Net score result per hole and year",
    "gridlines": {
      "auto": true,
      "spacing": 2
    },
    "color": {
      "box": {
        "paletteColor": {
          "index": -1,
          "color": "#68b5de"
        }
      },
      "point": {
        "paletteColor": {
          "index": -1,
          "color": "#3a7391"
        }
      }
    },
    "measureAxis": {
      "show": "labels",
      "dock": "near",
      "spacing": 1,
      "autoMinMax": true
    },
    "dimensionAxis": {
      "show": "labels"
    },
    "sorting": {
      "autoSort": false,
      "sortCriteria": {
        "sortByAscii": -1,
        "sortByLoadOrder": 1
      }
    }
  }
).then(function(vis){
  vis.show("QV01");
});
qlik-visual
<qlik-visual appid="Tutorial-Golf.qvf"
  type="distributionplot"
  cols='[
    {
      "qDef": {
        "qFieldDefs": [
          "=NetScoreName"
        ],
        "qFieldLabels": [
          "Net result"
        ]
      },
      "qNullSuppression": true
    },
    {
      "qDef": {
        "qFieldDefs": [
          "Date.autoCalendar.Year"
        ],
        "qFieldLabels": [
          "Year"
        ]
      },
      "qNullSuppression": true
    },
    {
      "qDef": {
        "qLabel": "Occurancies",
        "qDef": "Count(HoID)",
        "qNumFormat": {
          "qType": "F",
          "qnDec": 2,
          "qUseThou": 0
        }
      }
    }
  ]'
  options='{
    "showTitles": true,
    "title": "Net score result per hole and year",
    "gridlines": {
      "auto": true,
      "spacing": 2
    },
    "color": {
      "box": {
        "paletteColor": {
          "index": -1,
          "color": "#68b5de"
        }
      },
      "point": {
        "paletteColor": {
          "index": -1,
          "color": "#3a7391"
        }
      }
    },
    "measureAxis": {
      "show": "labels",
      "dock": "near",
      "spacing": 1,
      "autoMinMax": true
    },
    "dimensionAxis": {
      "show": "labels"
    },
    "sorting": {
      "autoSort": false,
      "sortCriteria": {
        "sortByAscii": -1,
        "sortByLoadOrder": 1
      }
    }
  }' >
</qlik-visual>


