
Monitor mode
In Monitor mode, you view the replication task activities in real time.
Viewing a task in Monitor mode
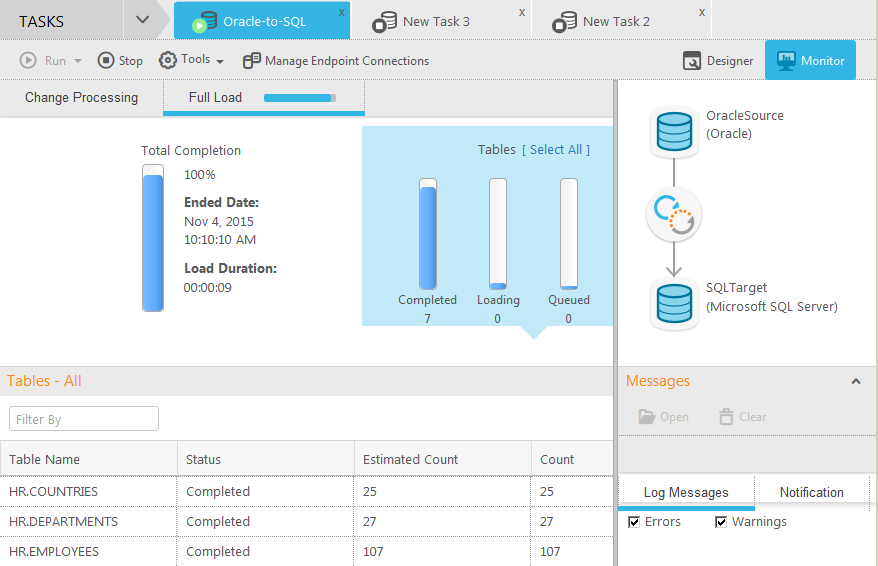
The Monitor mode includes the following elements:
- Run button: Lets you run the task at hand.
- Manage Endpoint Connections button: Lets you view the endpoints defined, edit them, or add new endpoints. For more information, see Defining and managing endpoints.
- Monitor and Designer buttons: Switch between Monitor mode and Designer mode. See also Monitoring and controlling replication tasks, Designer mode, Defining and managing tasks.
- Tools list: Provides access to history, log management, and status information.
- Change Processing/Full Load tabs: Lets you select the information you want to focus on. By default, Replicate displays the Full Load view (also shown in the figure).
- Task Map: Illustrates the connection between the source and target endpoints for the task. The round icon between the endpoints represents the task type, which can indicate Full Load only, Full Load and Apply Changes, or Apply Changes only.
- Messages pane: Displays notifications and logging messages. For more information, see Accessing task messages and notifications.
To display a task in Monitor mode:
- On the right side of the toolbar, click Monitor.