
Asset inventory dashboard
The information from the assets pages are summarized in a dedicated
Dashboard tab.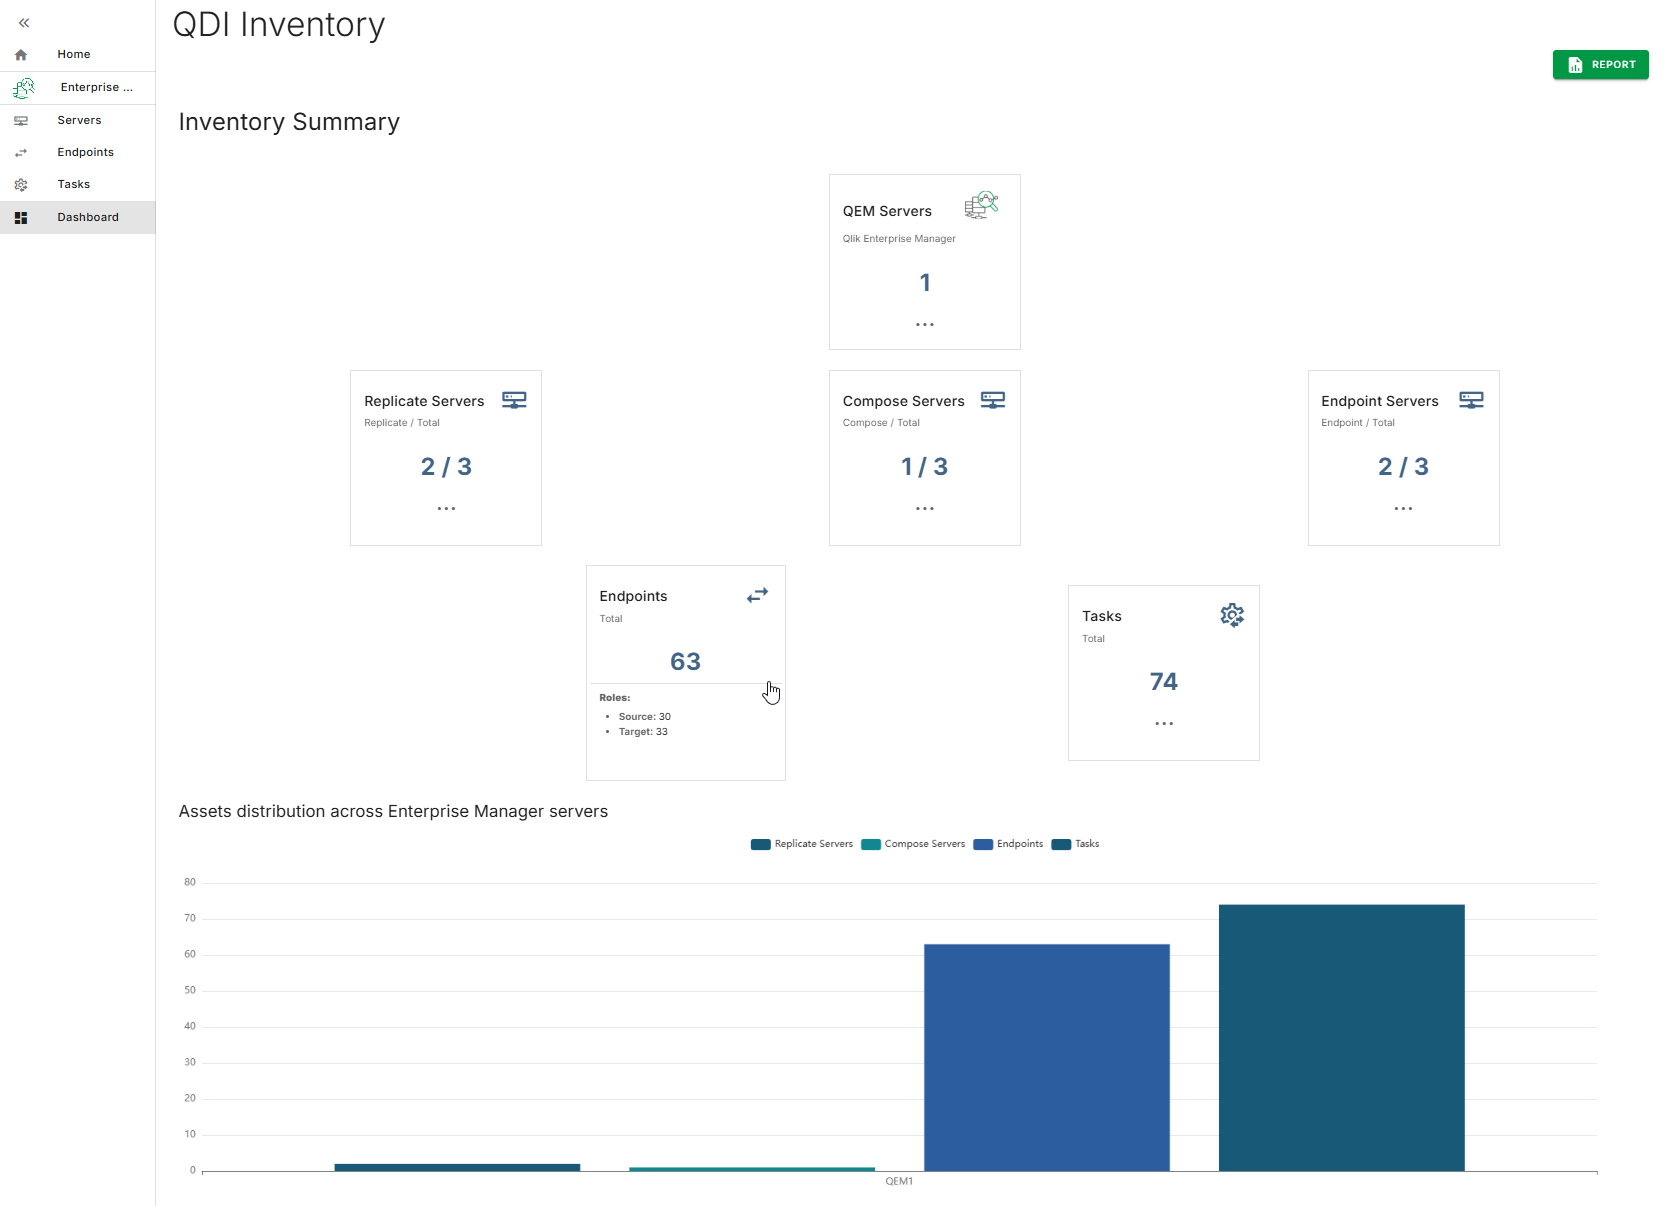
Each of the main assets as well as the Qlik Enterprise Manager servers metrics are listed in a dedicated tile.
You can hover the mouse over each tile to get additional details.
The bar chart summarizes the distribution of the different inventory assets across the
registered Enterprise Manager servers.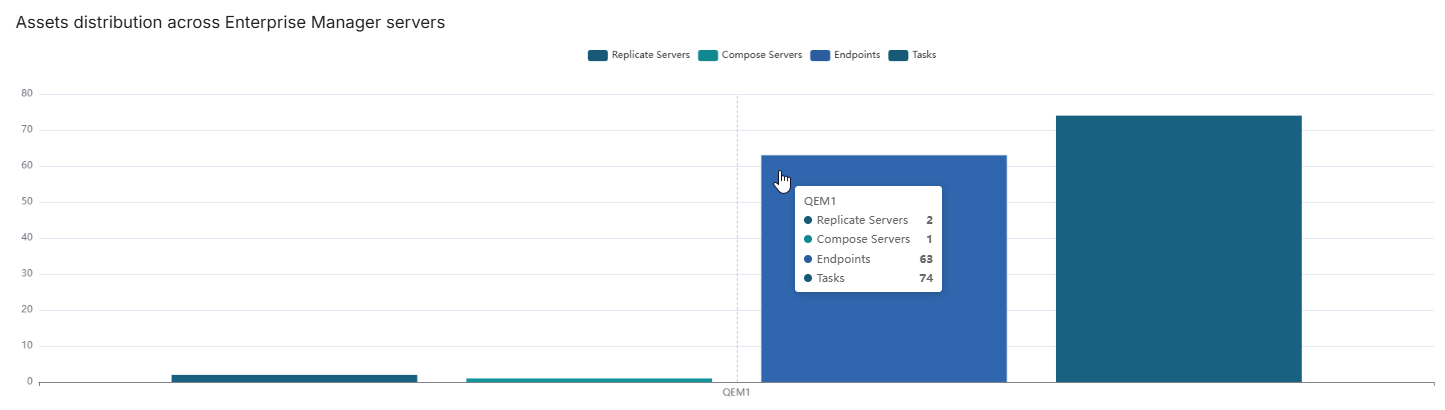
Each individual asset will also be displayed in an addendum at the bottom of the dashboard.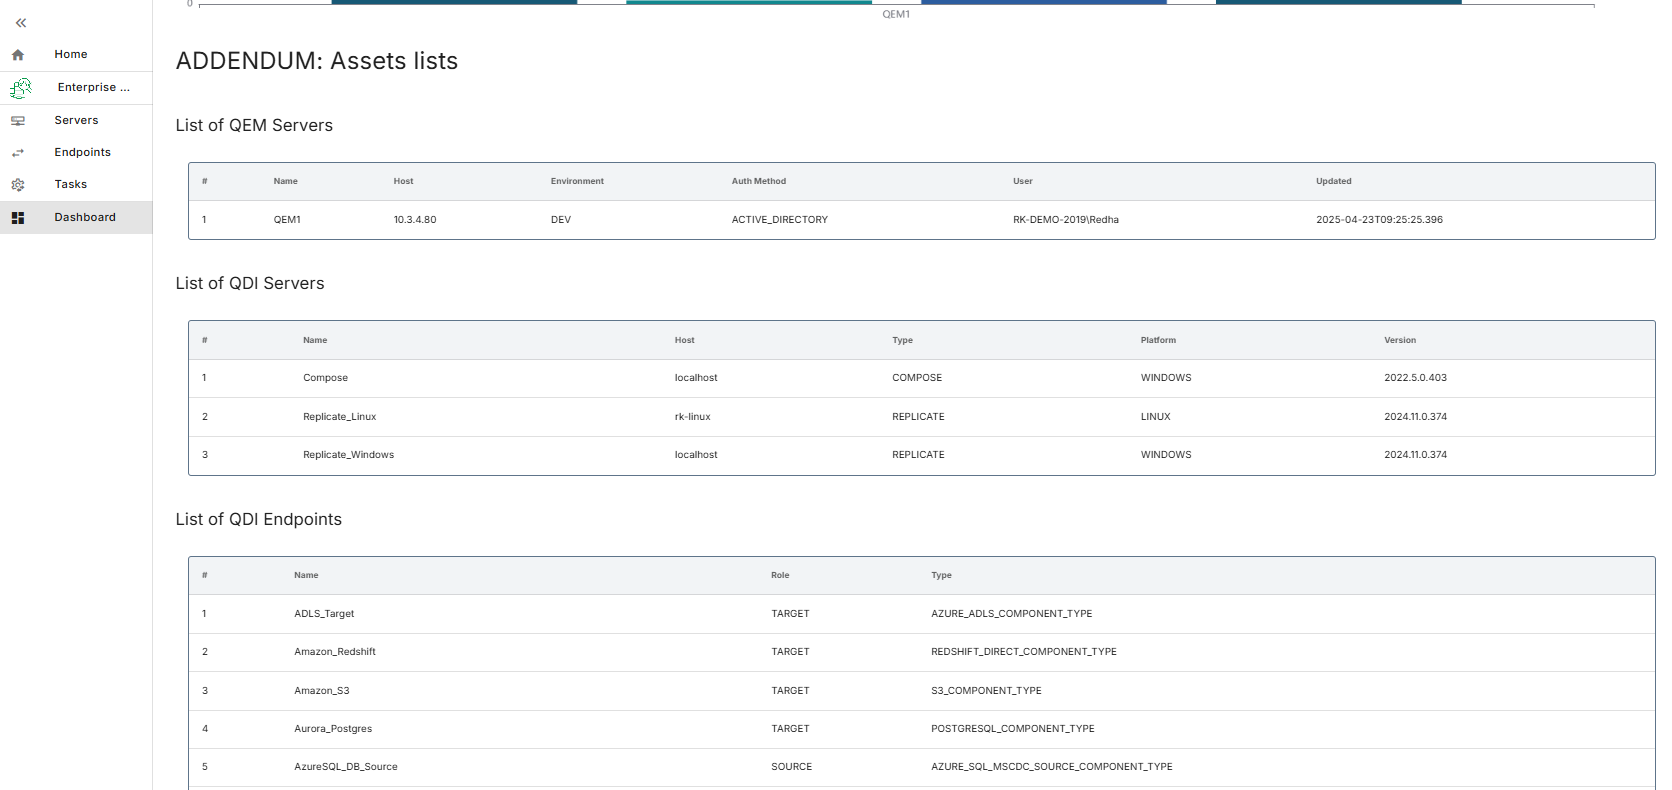
The  button provides a way to export all this information in a PDF document.
button provides a way to export all this information in a PDF document.