
Usage tracking can help identify potential improvements in resource usage and improvements that affect efficiency and effectiveness. The number of sessions for QVWs indicates where resources are concentrated and which applications are being used for business decisions. The QVD load dates indicate how often QVD files are being used or if they are not being used.
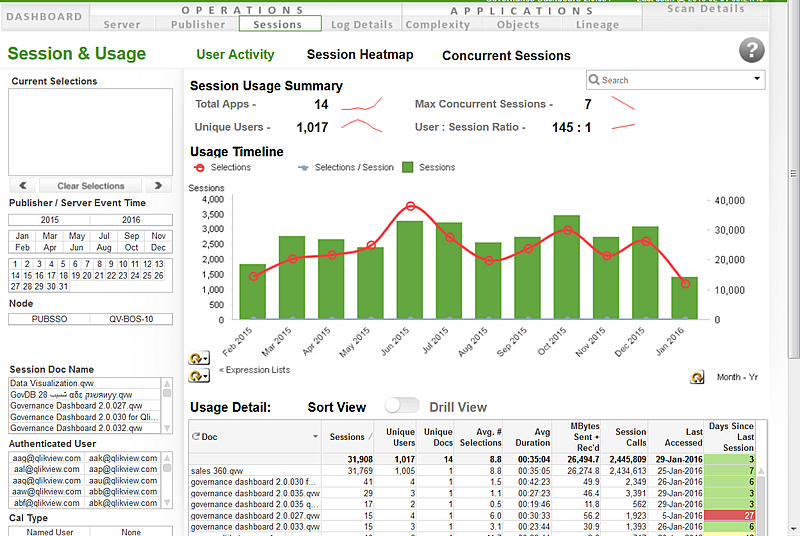
Number of sessions are indicated in the QVW Complexity section of the Complexity sheet. QVWs that are not accessed at all might be candidates for deletion. If they are run infrequently, you can check to see how recently they have been run. If the sessions are recent, then the application might be new or just starting to be used. Details of selected QVWs can be checked on the Sessions sheet in the Usage Detail list in the User Activity section.
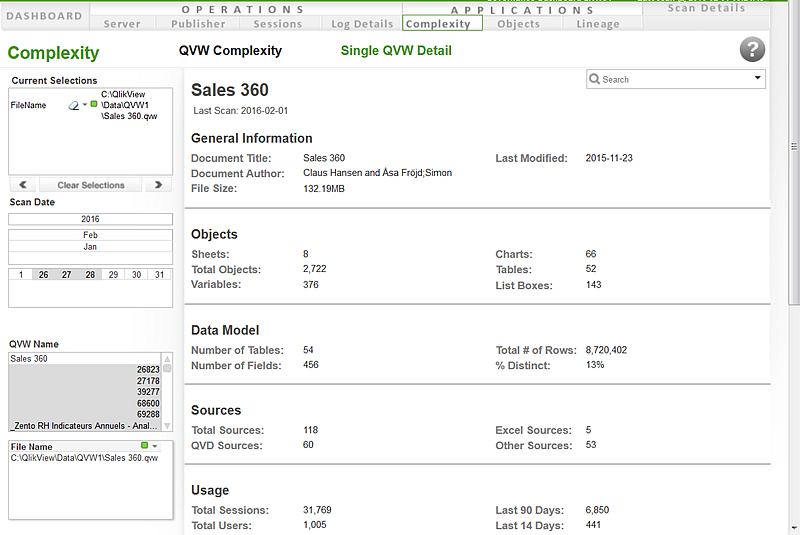
Further details on the usage of a QVW are available in the Single QVW Detail section of the Complexity sheet. The Single QVW Detail tab shows file size, total objects, number of tables, fields, and rows, data sources and how often it has been used in the last 14 and 90 days.
The Complexity Breakdown for Scanned Applications in the QVW Complexity section can also be used to identify QVWs that are large but seldom used. You can double-click on the Sessions column header of the Complexity Breakdown table to sort in ascending order and check to see which QVWs on the lower end of total sessions are large.
Even QVWs that show a significant number of sessions might be outdated. Because the sessions count is cumulative, it is possible that QVWs that were used heavily at one time are no longer used at all. Again, it is worth checking the Single QVW Detail section to see how often the QVW has been used in the last 14 days.