Information about Change Processing latency
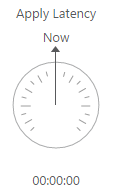
To view information about the time delay (latency) between the time when a change is visible to the source (and committed) and the time when this same change is visible to the target, in the <task name> tab, click the Apply Latency gauge. The Apply Latency Details area displays a graph illustrating the source and target latency. The display is always based on the current change being applied.
You should take the following into consideration:
-
Latency when applying large transactions:
For example, when the most recent latency value was 10 seconds and now a transaction of one million rows gets committed at the source endpoint, Qlik Enterprise Manager starts to apply that transaction to the selected target and it will take some time to write all the changes to the target (for example 60 seconds). During the next 60 seconds, the latency value gradually grows to 70 seconds for the last change in the transaction. Once the transaction is committed, the latency drops back to the 'regular' latency (10 seconds in this case).
-
Latency when no transactions are being applied:
When a time period passes with no changes applied to the target, the latency calculation is based on the time difference between the current time and the timestamp of the last change event read from the transaction log. This could happen if, for example, there is high activity on tables that are not selected for replication in the current task.