General Change Processing information
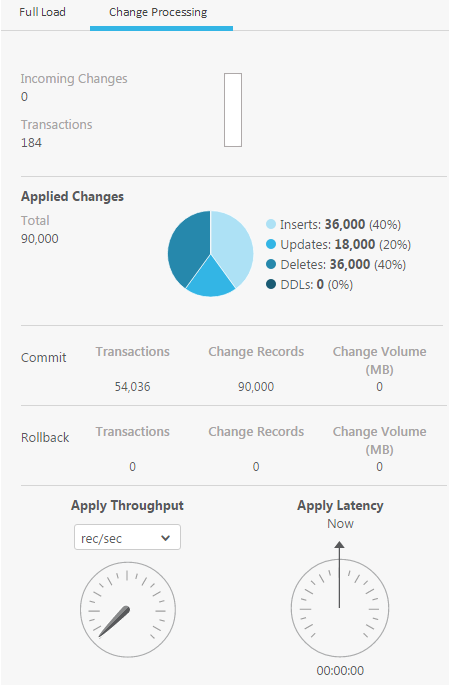
General information about change processing is presented in a graphical format, as shown in the following figure.
Task Dashboard - Change Processing Status

This following information is displayed:
- Overall Progress bar: The overall progress of the task.
- Incoming Changes: The number of records that were processed for the task.
- Transactions: The number of transactions that were processed for the task.
-
Applied Changes: A pie chart showing information about the processed changes:
- The number of INSERT operations processed. Roll over the Inserts section with your mouse to see the number and percentage of the accumulated inserts.
- The number of UPDATE operations processed. Roll over the Updates section with your mouse to see the number and percentage of the accumulated updates.
- The number of DELETE operations processed. Roll over the Deletes section with your mouse to see the number and percentage of the accumulated deletes.
- The number of metadata changes (DDL) processed. DDL changes include information about events like changes to table names or to column names.
- Commit: The number of committed transactions and change records as well as the change volume, in MB.
- Rollback: The number of rolled back transactions and change records as well as the change volume, in MB.
- Apply Throughput: A gauge that describes the number of change events read per second. For additional details, see Information about Change Processing throughput.
-
Apply Latency: A gauge that displays latency information.
The latency values in Qlik Enterprise Manager measure the time delay (latency) between the time when a change is visible to the source (and committed), and the time when this same change is visible to the target. The display is always based on the current change being applied.
For additional details, see Information about Change Processing latency.
