
Working with levels and pages in tabular report templates
With levels and pages, you can automatically generate new sections and worksheets in your tabular reports. With levels and pages, a new filtered section or worksheet is generated for each unique value in a field, or row in a chart source table.
Levels and pages provide an additional layer of data filtering to reports, on top of the report filters you can apply in your Qlik Sensereport tasks. You can use a combination of levels, pages, and report filters to generate highly customized and individualized report output. For information on report filters, see Working with report filters.
Click the ![]() icon on the top toolbar of the add-in to open the Levels and pages tab. This is where you add, modify, and delete level and page objects.
icon on the top toolbar of the add-in to open the Levels and pages tab. This is where you add, modify, and delete level and page objects.
Applies to
This content applies to designing tabular report templates using the Qlik add-in for Microsoft Excel. See Qlik add-in for Microsoft Excel.
Similar functionality exists for PowerPoint and Word templates, with some notable differences. For more information, see:
Levels
Levels cycle report elements through all the distinct values of a field, or per row in the chart source table. Use levels to create sections in your report. Within a level, you add the content for which you want to have filtered, repeated sections.
You can use the following items as levels:
-
Field: If you use a field as a level, a filtered section is added for each distinct value in the field.
-
Chart: You can also use a chart as a level.
The following are examples of how you can use levels in the template:
-
Create a level for a Year, YearMonth, or YearQuarter dimension. Within the level, nest tabular data with dimensions and measures like Product Group, Store Number, and Sales.
-
For a report detailing support ticket progress, create a level for an Incident Status dimension. Within the level, nest tabular data with dimensions and measures like Ticket ID, Assignee, Ticket Opening Date, Ticket Closing Date, and Time Spent to Close.
Adding a level
Do the following:
-
Click the
 icon on the top toolbar of the add-in. A list of any existing levels appears.
 -
Click Add level.
Levels and pages tab in Qlik add-in for Microsoft Excel. This tab allows you to add a new level or page, or revisit one you have already added.

-
Expand an item in the list. Your list will contain Fields, as well as each sheet containing compatible charts. Click the
 icon to the right of the item you want to use as a level.
 -
After you click
, a list of field tags appears under Select fields to add (optional). In the generated report, the field tags appear in every section generated by the level tag. For more information about field tags, see Field tags. -
Click Add. The level tags are added to the currently selected area. Any field tags are inserted between the level tags.
Level and field tags inserted into the template

-
After the level and field tags are inserted, move them around as needed and begin adding content inside the level.
Report template modified to include additional tabular data within the level tags

Revisit any level object you have added at any point for modifications to its configuration, to locate it in the workbook, or to add another instance of it to the workbook. Click the ![]() icon in the add-in to open the Levels and pages landing page, and click
icon in the add-in to open the Levels and pages landing page, and click ![]() to navigate to the cell where it is inserted. Adjust any settings as needed in the add-in.
to navigate to the cell where it is inserted. Adjust any settings as needed in the add-in.
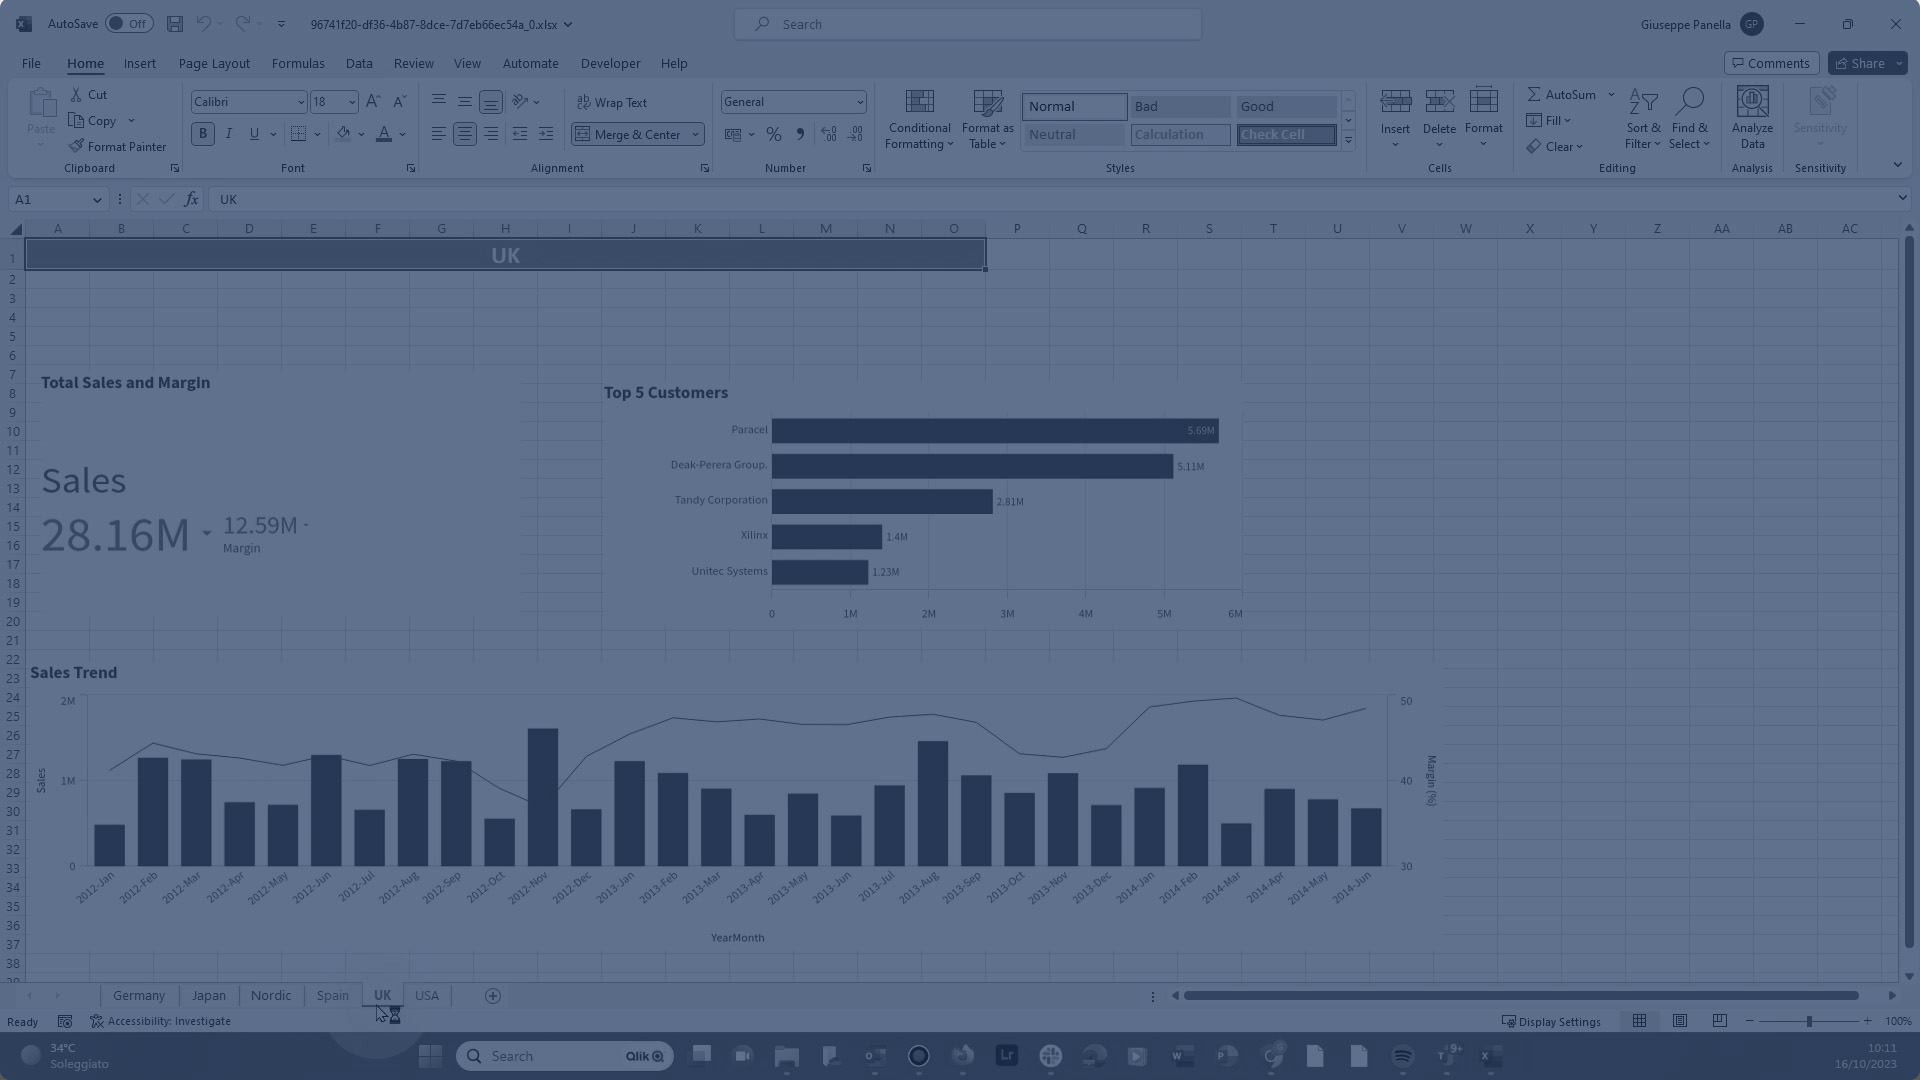
The report created from the template above might look like the following:
Report generated from template which uses a level for a Year field
Tabular report generated from template which uses a level for a Year field

Using a chart as a level — practical use case
When you add a chart as a level, the data is separated into a section for each row-level combination of values. For example, if your level is a chart with one dimension and one calculated measure, a section will be created for each dimension value, with the measure value treated as the single possible unique value for that particular dimension. The images below illustrate this.
Let's say you create the report template below. In this template, we have a level for a Sales Per Region chart. This chart has two fields (Region and Sales), which are also inserted as field tags. Inside this level, we added three columns of tabular data.
Report template containing a level created from a chart

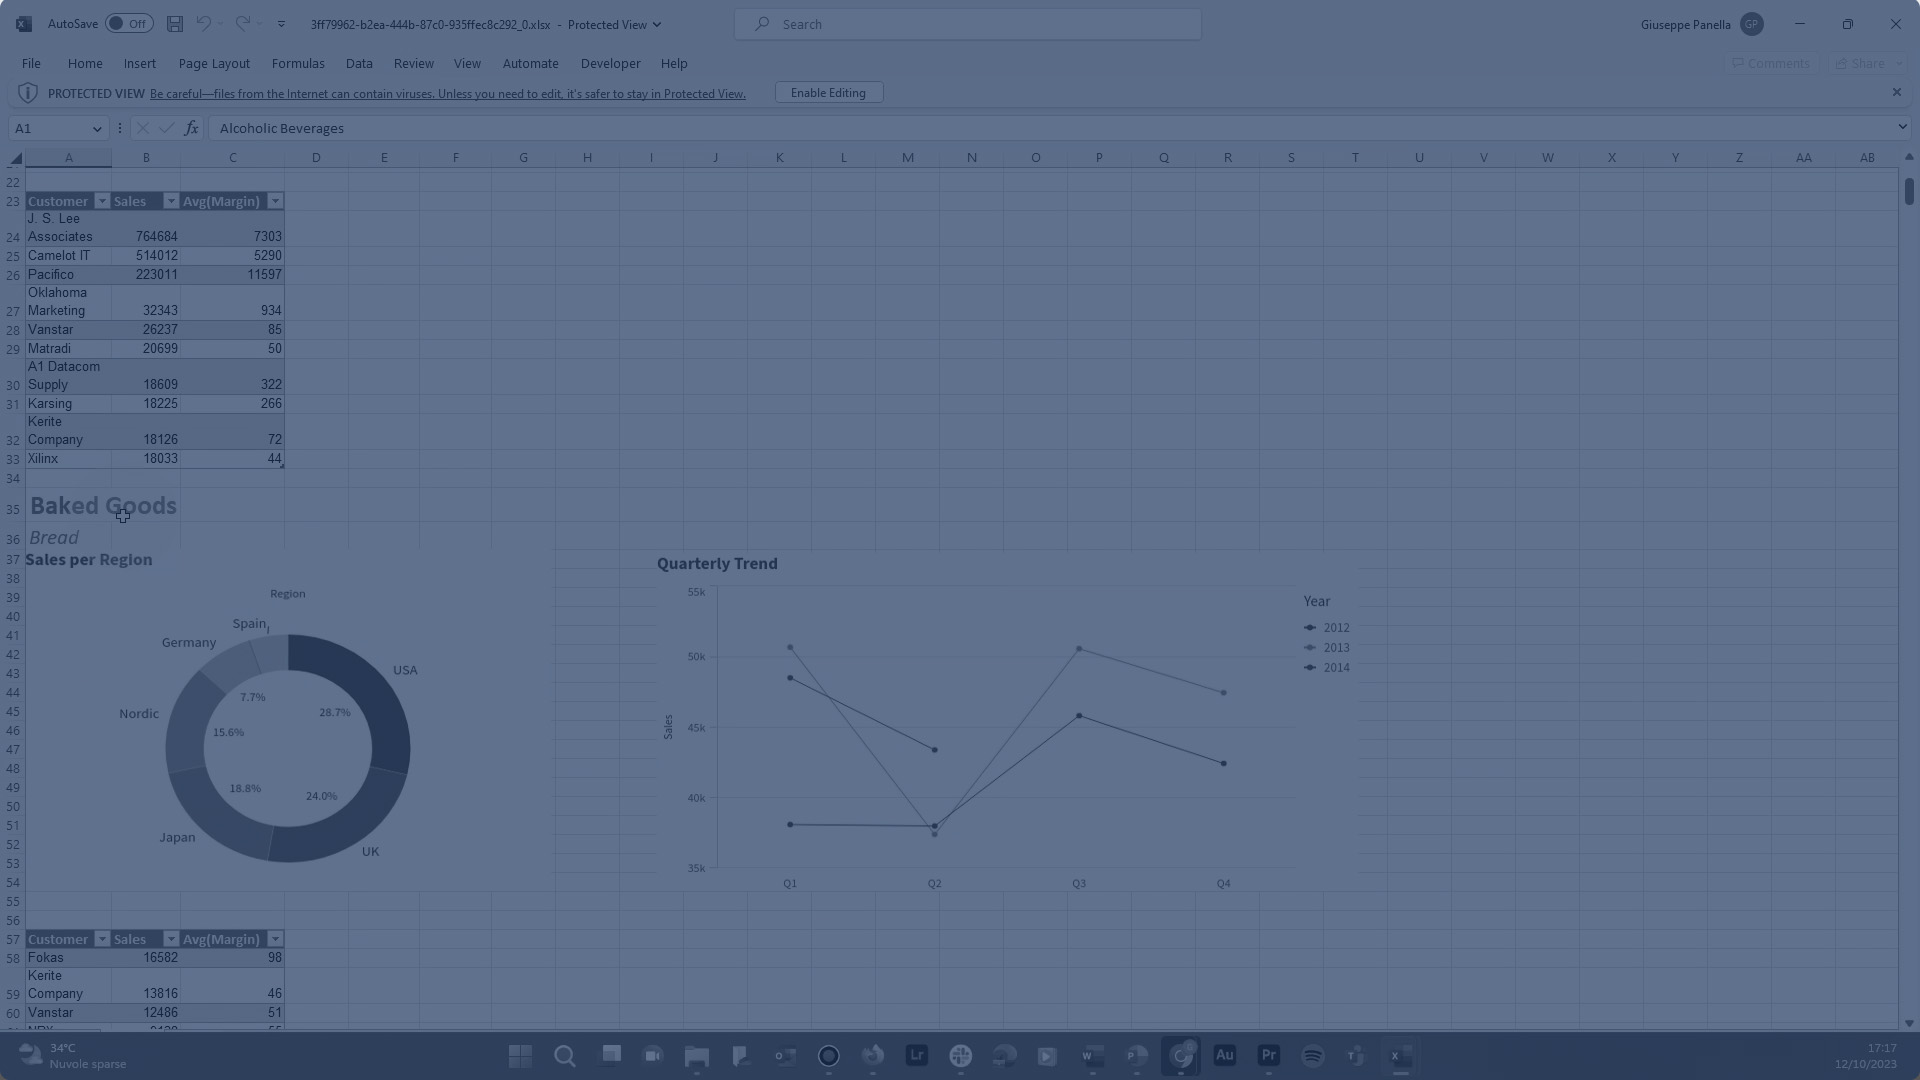
This template will result in the truncated report shown in the image below. Note that a separate section is created for each dimension value in the source chart (for example, USA and UK), each of which also has a single unique corresponding measure value.
Report output template containing a level created from a chart

Nesting levels
You can also create complex hierarchies by nesting levels within levels.
For example, let's say you nest a level by Country within a level by Year. Within the Country level, let's say you insert one chart image. In this case, the number of images generated in the report would be the distinct number of years, multiplied by the distinct number of countries. This example illustrates that without filters, you could easily exceed the limits of the cloud when nesting report elements inside one another.
Refer to Limitations for in-application reporting for a list of the limits that apply to using levels and pages.
Pages
You can create different filtered Excel worksheets using pages.
Adding a page tag to a worksheet name will generate a separate, filtered page for each unique entity value linked to it. Data in each worksheet are filtered by the related value of the field or the source table row. You can create a page using the following items:
-
Field: If you use a field as a page, you will have a worksheet for each distinct value in the field.
-
Chart: You can also use a chart as a page. The chart can only have one dimension.
Adding a page
You can use fields and compatible charts as pages.
Do the following:
-
Click the
icon on the top toolbar of the add-in. A list of available level and page objects appears. -
Click Add page.
Levels and pages tab in Qlik add-in for Microsoft Excel. This tab allows you to add a new level or page, or revisit one you have already added.

-
Expand Fields, and click the
icon to the right of the field you want to use as a page. Alternatively, if your application has a compatible chart, expand the section for the sheet on which it appears.In this example, the page tag will create a new section for each unique Manager value in the application.
Select a field to use as the page

-
After you click
, a list of field tags appears under Select fields to add (optional). If you choose to include the field tag, it will be inserted at your current position in the worksheet. In the generated report, the field tag will appear on every worksheet generated by the page tag. It will display the field value to which the page applies. For more information about field tags, see Field tags. -
Click Add. The page tag is added to the name of the worksheet. Any field tags are added as well, if you have included them.
Page and field tags inserted into the template

With some adjustments and the addition of some tabular data columns, the report output might look like the following image. A new worksheet is generated for each manager.
Report generated from template which uses a page tag for a Manager field

Revisit any page object you have added at any point for modifications to its configuration, to locate it in the workbook, or to add another instance of it to the workbook. Click the ![]() icon in the add-in to open the Levels and pages landing page, and click
icon in the add-in to open the Levels and pages landing page, and click ![]() to navigate to the worksheet where it is inserted. Adjust any settings as needed in the add-in.
to navigate to the worksheet where it is inserted. Adjust any settings as needed in the add-in.
Field tags
A field tag is a unique tag that can be added inside a level tag, or in a cell on a worksheet defined with a page tag. Field tags are not objects. Instead, they are elements within level and page objects, and they are optional.
For each field you are adding as the level or page, a field tag can optionally be added. The field tag displays the field value for each discrete entity on which the level or page is looping the data generation. Within a level or page, a field tag often functions as a section header, but it still contains tabular data.
Access the fields and field tags for a level or page by selecting the cell containing the level or page, and looking under Fields in the object's settings.
Field tags can be removed by deleting or clearing the area in which they have been added. Add a field tag back by clicking Add field tag under Fields in the object's settings.
A field tag can be set to Keep source formats, or this setting can be turned off to apply custom formatting and styling to the cell using the native Excel features.
Removing a level or page
Like with any other object, you can remove a level or page from the report template, and from the list of that object type in the add-in pane.
Do the following:
-
Select the area where the object is located.
-
Click Delete in the bottom of the add-in window.
This removes the tags and the object from the corresponding object list.
If you instead use Excel features to delete a level or page, it will not be inserted in the generated report. However, the object will still appear in the list of added objects. This means you can easily re-add the object later.