Creating a new report
- Big Data Platform
- Cloud API Services Platform
- Cloud Big Data Platform
- Cloud Data Fabric
- Cloud Data Management Platform
- Data Fabric
- Data Management Platform
- Data Services Platform
- MDM Platform
- Qlik Cloud Enterprise Edition
- Qlik Talend Cloud Enterprise Edition
- Qlik Talend Cloud Premium Edition
- Real-Time Big Data Platform
Defining the report
- Big Data Platform
- Cloud API Services Platform
- Cloud Big Data Platform
- Cloud Data Fabric
- Cloud Data Management Platform
- Data Fabric
- Data Management Platform
- Data Services Platform
- MDM Platform
- Qlik Cloud Enterprise Edition
- Qlik Talend Cloud Enterprise Edition
- Qlik Talend Cloud Premium Edition
- Real-Time Big Data Platform
Before you begin
Procedure
- In the tree view of DQ Repository, expand Data Profiling.
-
Right-click the Reports folder and select New
Report.
The report creation wizard opens.
-
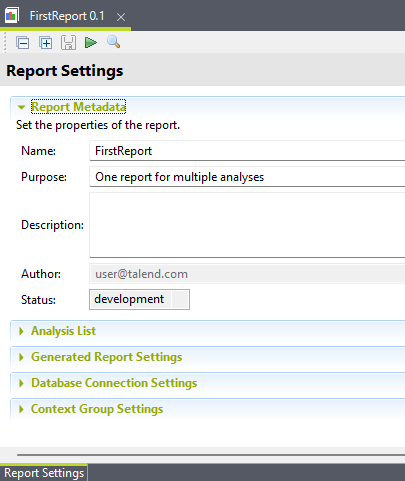
In the Name field, enter a name for the report.
Information noteImportant:
Do not use the following special characters in the item names: ~ ! ` # ^ * & \\ / ? : ; \ , . ( ) ¥ ' " « » < >
These characters are all replaced with "_" in the file system and you may end up creating duplicate items.
- Optional:
Set report metadata (Purpose,
Description and Author) in the
corresponding fields and click Finish to close the dialog
box.
A node for the new report is displayed under Reports in the DQ Repository tree view, and the report editor opens with the defined metadata.
 Information noteRemember: The display of the Analysis Results view depends on the parameters you set in the Preferences window. For more information, see Setting preferences of analysis editors and analysis results.
Selecting the analyses you want to include in the report
- Big Data Platform
- Cloud API Services Platform
- Cloud Big Data Platform
- Cloud Data Fabric
- Cloud Data Management Platform
- Data Fabric
- Data Management Platform
- Data Services Platform
- MDM Platform
- Qlik Cloud Enterprise Edition
- Qlik Talend Cloud Enterprise Edition
- Qlik Talend Cloud Premium Edition
- Real-Time Big Data Platform
Procedure
-
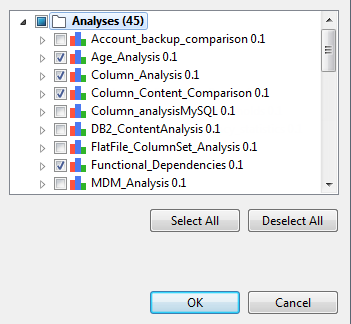
Click Analysis List to display the
corresponding view and then click the Select
analyses link to open a dialog box listing all analyses in the
Analyses folder.

-
From the list, select the check boxes of the analysis/analyses you want to include
in the report and click OK.
If you select a Correlation Analysis from the list, a warning message pops up to indicate that the analysis cannot be integrated in the report because it is not supported.The selected analysis/analyses are listed in the table in the Analysis List section.
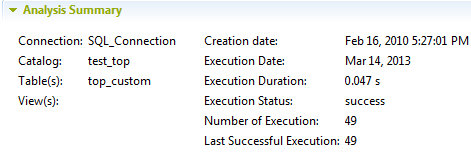
 The Refresh and Refresh All check boxes are selected by default. This means that the analyses in the list will be executed before generating the report and thus you guarantee having the latest results in your report if any of the analyses was modified meanwhile. Otherwise clear the check box next to the analysis you do not want to execute before generating the report.Another benefit of selecting these check boxes is that the analysis summary for each of the listed analyses, for example the indicator values and the execution time and duration, will be updated in the Talend Studio repository. You can access the analysis summary in the Analysis Results section of the analysis editor.
 However, the analysis information in the repository and thus in the Analysis Summary view will not be updated when you generate reports using a report script or using the tDqReportRun component. These two ways of generating reports will store the analysis latest values in the data mart and will show them in the report itself but will not update the analysis values in the repository.For further information on using a report script to generate reports, see Generating and exporting a report Job.For further information on using tDqReportRun to generate reports, see Generating a Job to launch a report.
 - Optional: Right-click an analysis in the list and select Edit Analysis from the contextual menu to open the analysis in the analysis editor. Modify the analysis metadata and save your changes.
-
In the Template type column, click the arrow
and then select a template type for the generated report as the
following:
Option Results Basic Generate a report that provides the statistics collected by the analysis selected in a given report. Evolution Generate an evolution report that provides information showing the evolution through time of the simple statistic indicators of the analyses selected in a given report. This report allows you to compare current and historical statistics to determine the improvement or degradation of the analyzed data. User defined Use a personalized report created with the JasperReport reporting tool and imported in Talend Studio. When you select User defined as the template for the report to generate, you must click the Browse... button next to the field and set the path to the JRXML template imported into the current Talend Studio instance. This path points to where the JRXML template is saved in the DQ Repository of Talend Studio. This browse button will only browse the JRXML templates in the Talend Studio repository and not in your file system.
For further information on managing JRXML templates see Using JRXML templates in Talend Studio.
Defining the report settings
- Big Data Platform
- Cloud API Services Platform
- Cloud Big Data Platform
- Cloud Data Fabric
- Cloud Data Management Platform
- Data Fabric
- Data Management Platform
- Data Services Platform
- MDM Platform
- Qlik Cloud Enterprise Edition
- Qlik Talend Cloud Enterprise Edition
- Qlik Talend Cloud Premium Edition
- Real-Time Big Data Platform
Procedure
-
In the Generated Report Settings view, clear the Generate output file check box if you want only to store the analysis results in the data quality data mart without generating an output report file.
- Available in:
- Big Data Platform
- Data Fabric
- Data Management Platform
- Data Services Platform
- MDM Platform
- Qlik Cloud Enterprise Edition
- Qlik Talend Cloud Enterprise Edition
- Qlik Talend Cloud Premium Edition
- Real-Time Big Data Platform
Otherwise, keep it selected to both store analysis results in the data quality data mart and to generate an output report file when you run the report. -
Click the [...] button next to the Output
Folder field and browse to the folder in which you want to save
a copy of the generated report.
Information noteTip: The folder you define in this field will store only the current report. However, you can define a by-default folder where you store all reports you generate from the Profiling perspective. For further information, see Creating a report on specific analyses.If you define an output report folder in this field, the report document you generate will be stored in this folder but will not be committed on the Git server that hosts the shared repository.To commit the report document on the Git server and share it with the other team members who access the same remote project, leave the Output Folder field empty.
- In the Output File Name field, enter a name for the generated report.
- Select a type for the generated report from the File Type list.
- Clear the with timestamp check box to overwrite the output report file each time you run the report. Otherwise, keep it selected to generate a new output file each time you run the report.
- Enter the date range for the analysis execution.
- Define the settings for the report layout as desired in the corresponding fields and browse for a logo to add one to the report file.
Setting a database for the report
- Big Data Platform
- Cloud API Services Platform
- Cloud Big Data Platform
- Cloud Data Fabric
- Cloud Data Management Platform
- Data Fabric
- Data Management Platform
- Data Services Platform
- MDM Platform
- Qlik Cloud Enterprise Edition
- Qlik Talend Cloud Enterprise Edition
- Qlik Talend Cloud Premium Edition
- Real-Time Big Data Platform
Procedure
-
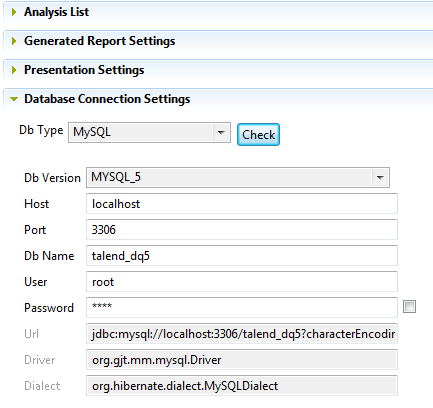
Click Database Connection Settings to open the corresponding
section and set the parameters of the database as outlined in Setting up a database for an individual report.
 The database connection you set here will be only for the current report and can be different from the by-default distant database you define in the Talend Studio Preferences window. For further information on how to configure a distant database for all reports, see Setting up a distant database.
 -
Click the save icon on the toolbar of the report editor to save the defined
settings.
The report is created and listed under the Reports folder in the DQ Repository tree view.This new report is now ready to be generated. For more information, see Generating report files.
Did this page help you?
If you find any issues with this page or its content – a typo, a missing step, or a technical error – please let us know!
