An example of an evolution report
Before you begin
About this task
Procedure
Results
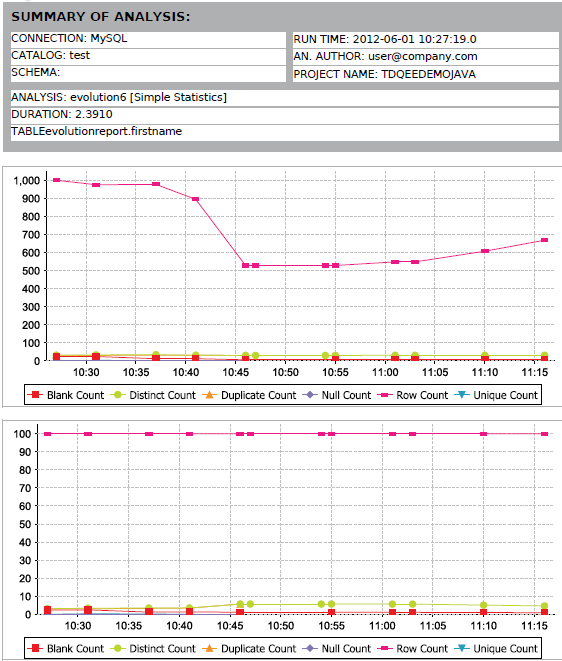
In every evolution report, you will have two graphics: the first indicates the change in the statistics and the second indicates the percentage of that change.
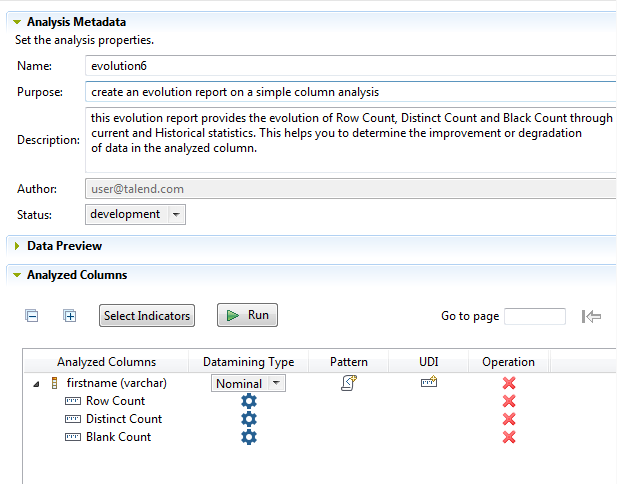
The above report then tracks the evolution through time of the row count, distinct count and blank count of the data records in the column.
Information noteImportant: If you import the items in an evolution report in another project in
Talend Studio, the evolution chart will not display the data of the previous project. For further
information on how to show the evolution of data through all projects, see Migrating evolution reports.


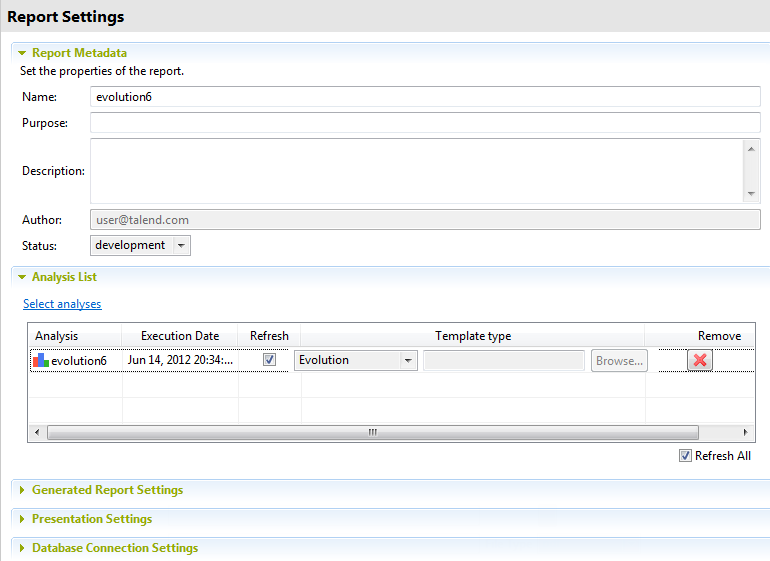
 to generate the report file.