Skip to main content Skip to complementary content

Enabling Job monitoring on Remote Engines

Before you begin

  • Talend Studio version 7.3 R2020-07 or later is installed but not running.
  • Talend Remote Engine version 2.9.2 onwards is created, installed, and paired in your Talend Management Console account.
  • Avoid deploying Talend Remote Engine with Docker in a Kubernetes cluster, as Remote Engine does not support this type of containerized deployment for the Job monitoring feature.
  • Ensure the usage of a dedicated folder for the data and etc folders of your engine. These folders store the configuration files for a Remote Engine. Using a dedicated folder for the configuration files prevents them from being locked in a read-only mode or concurrently modified by multiple processes.

Procedure

  1. Open the <RemoteEngineInstallationDirectory>/etc/org.talend.ipaas.rt.observability.cfg file to edit it.
  2. Enable the following parameters by setting their value to true:

    Note that omc in these parameters means Observability Metrics Collector.

    • omc.re.enabled=true: Remote Engine metrics are activated
    • omc.oshi.enabled=true: entire OS metrics are activated
    • omc.apm.enabled=true: APM appender is activated
    • omc.appender.prometheus.enabled=true: metrics appender for the Prometheus format is activated
    The following three parameters are read only:
    • omc.enabled=true: the main property activated to ensure that the whole metrics mechanism works
    • omc.jobs.enabled=true: the property activated to collect Job metrics
    • omc.appender.rest.enabled=true: metrics appender for HTTP REST format is activated
  3. Set the omc.push.frequency_ms parameter to the desired value.
    The push frequency parameter defines the frequency at which Remote Engine components produce their metrics. Increase its value to send metrics to the APM less often, or decrease its value for more precise monitoring.
  4. Optional: Depending on your license, the metrics could be displayed by default on the Run overview page in Talend Management Console.
  5. Save the file.
  6. Open the <RemoteEngineInstallationDirectory>/etc/org.talend.observability.omc.cache.apm.cfg file to edit it.
  7. Set the timeToLiveMinMilliseconds parameter to the desired value (in milliseconds).

    The time to live limit of the metrics in the Observability Metrics Collector (omc) is based on the push frequency.

    The default value is 1000. Increasing this value increases the time the metrics are available for, though it must always be higher than the push frequency.
  8. If needed, set the timeToLiveMargin to ensure there are no gaps when a component encounters an unexpected error or lag.
    The default parameter value, 5 milliseconds, can be edited but it is recommended not to edit it for security reasons.
  9. Save the file.
  10. Optional: You can also activate contextual information about the Jobs in the <RemoteEngineInstallationDirectory>/etc/org.talend.ipaas.rt.observability.jobContextConfig.cfg file by setting parameters to true.

    Example

    karaf/workspaceName=true
    karaf/environmentId=false
    karaf/environmentName=true
    karaf/environmentVersion=true
    karaf/clusterId=false
    karaf/clusterName=false
    karaf/planExecutionId=false
    karaf/planId=false
    karaf/planName=false
    karaf/planStepExecutionId=false
    karaf/planStepId=false
    karaf/planStepName=false
    karaf/triggerTimestamp=false
    karaf/artifactName=true
    karaf/artifactVersion=true
    karaf/taskName=true
    karaf/taskVersion=true
    karaf/compatibilityVersion=true
    karaf/runType=false
    karaf/countOfAttempts=false
  11. Save the file.
  12. Start the Remote Engine.
    You can also configure remote access to the engine by following the instructions in Enabling remote access using HTTP (optional).

    Depending on your license, the metrics could be displayed by default on the Run overview page in Talend Management Console.

What to do next

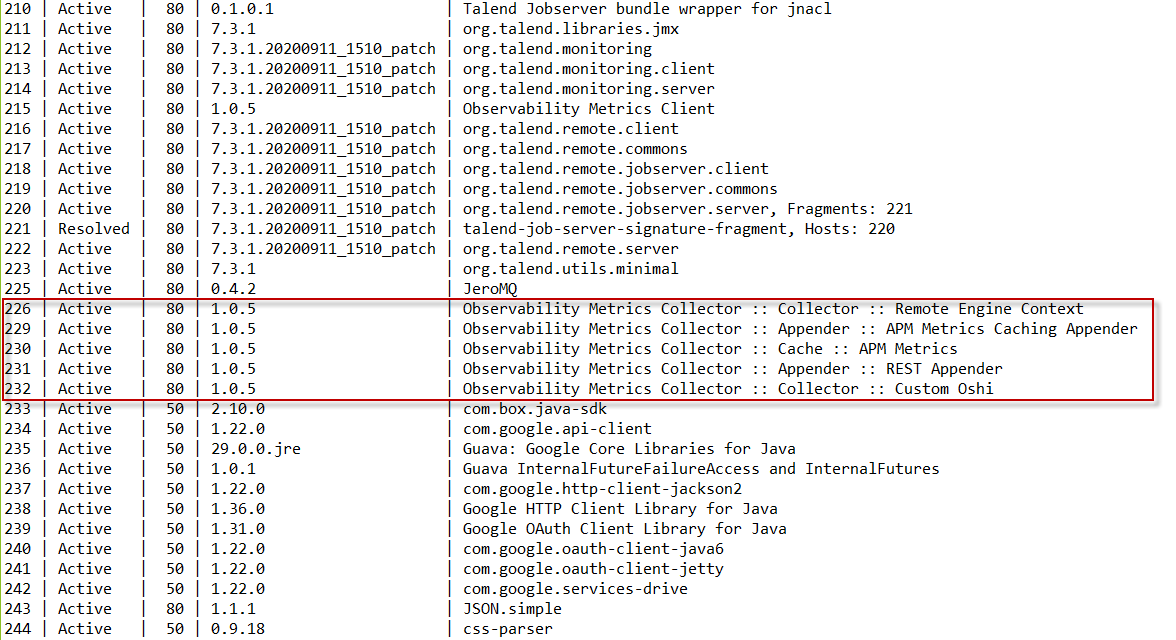
To validate that the monitoring feature is enabled, enter bundle:list in the console. All Observability Metrics Collector entries must be in Active status.
Screenshot showing all Observability Metrics Collector entries in Active status in the console.

Did this page help you?

If you find any issues with this page or its content – a typo, a missing step, or a technical error – please let us know!