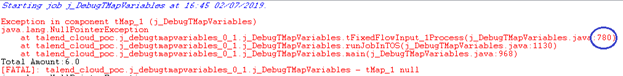
In the example given in the previous section, you can also debug the Job by looking at the
Java code that Talend Studio
generates, so as to locate the error returned by Java (in this case, a null pointer
exception). In this example, notice the line number (780) in the first line of the
error message.
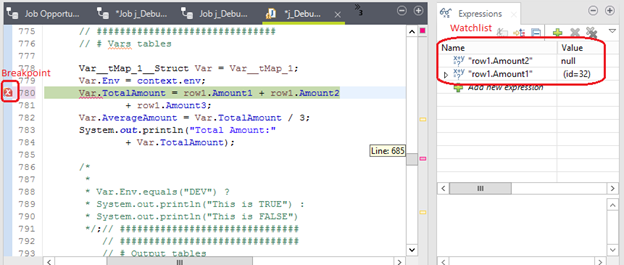
By opening the Code tab in Talend Studio and go to
the line number causing the error (780), you can infer from the screenshot below that one
of the fields – Amount1 or Amount2 – has null data. This
is especially helpful when you have a lot of fields within a component, and you want to
identify which of these fields is causing the null pointer exception.
Information noteNote: This debugging method assumes that you are familiar with Java programming.
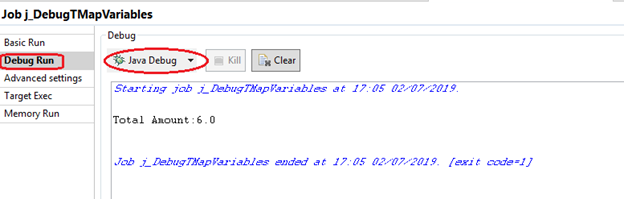
To debug the Job in the Java Debug mode:
With your Job open in Talend Studio, open
the Run view and then select Debug
Run.
Click the Java Debug button. The Job runs and Talend Studio
switches to the Debug view, where a Java code view is created in
the workspace. The Java code view contains the Java code of the Job generated by
Talend Studio.
Information noteNote: Click the triangle in the right part of the button and select Java
Debug if Java Debug does not appear on the
button.
Debug the Job in the Debug view. You
can set breakpoints and inspect/watch the values of the fields passing through the
data flow.
Did this page help you?
If you find any issues with this page or its content – a typo, a missing step, or a technical error – please let us know!


 Information noteNote: Click the triangle in the right part of the button and select Java Debug if Java Debug does not appear on the button.