Describing the Custom Reports page
You can use the Custom Reports page in the Talend DQ Portal to build and save your own interrogations.

From this page, you can:
-
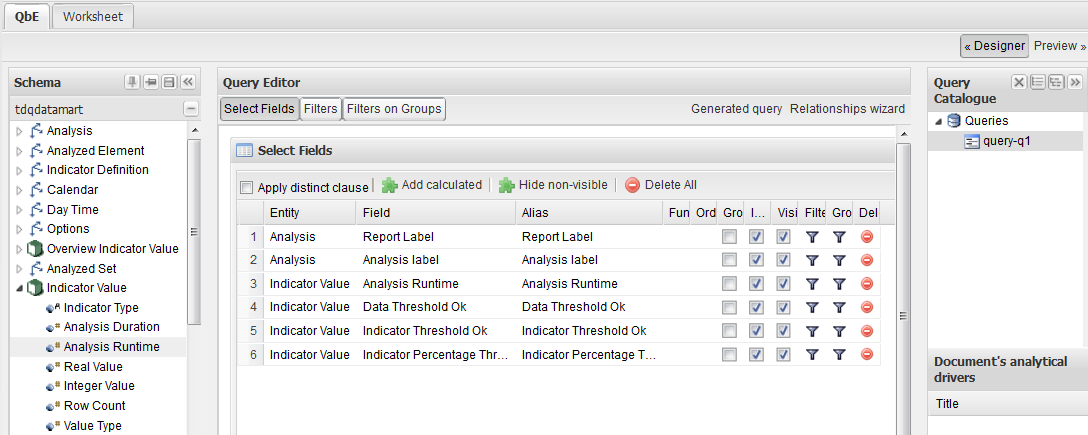
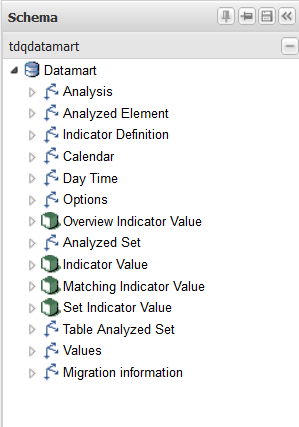
Access the Talend report datamart in the Schema panel.
The table list in the datamart differs according to the database used in the datamart.jar file. For further information about how to configure a datamart other than Talend datamart in the web server , see Connecting to another datamart from the QBE page.
-
Create new queries by a drag&drop operation of the elements from the Schema panel to the Query Editor, or by a simple click on the element itself. For further information, see Building a query.
-
Add one or several worksheets to the interrogations you create in the QBE page through the Worsksheet > Designer tab. In these worksheets, you can use different types of charts or tables to represent the query results. For further information on worksheets, see Creating a worksheet for the QBE results, and the SpagoBI quick start pdf at http://forge.objectweb.org/project/showfiles.php?group_id=204.
-
Access a list of all defined queries in the Customized views at the bottom of the page. For further information on how to access this view, see Accessing the list of the defined queries.
-
Access the Query Catalog panel to the right of the Query Editor. From this panel, you can create in each parent query one or more sub-queries to form groups of queries in a hierarchical tree. For further information, see Creating and saving a group of queries.
-
Delete all listed elements in the Query Editor by clicking the
 icon in the top right corner,
 -
Delete only one element in the list. To do this, click the
 icon next to the element you want to delete. These icons
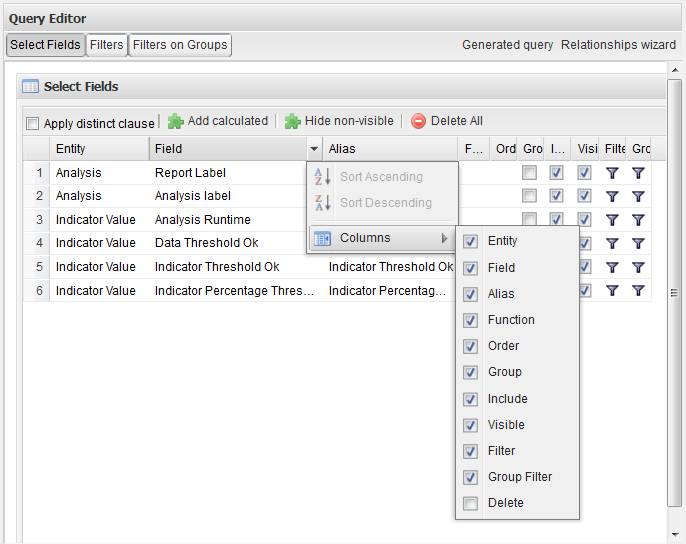
are not shown by default. To display them, put your pointer on a column name and
click the drop-down arrows and then from the Columns list, select the Delete
check box.
From the QBE page and in the Schema panel, you can have access to fact ( ) and dimensional (
 ) tables.

Fact tables stores the statistics and results of different analyses carried on in the Profiling perspective of Talend Studio while dimensional tables store the metadata about analyses. Dimensional tables are also listed under the fact tables.
