After designing your customized query using the QBE tool and interrogating the
data mart that stores the analysis results, you can build a worksheet to represent the
query results in charts or tables. You can also publish this worksheet and share it with
other team members.
Due to a limitation in SpagoBI, you cannot create worksheets for the QBE results when the
data mart database type is MS SQL Server.
Before you begin
You have accessed Talend DQ Portal as
a user.
A query has been created and executed on some analysis results in the datamart
as outlined in Building a query.
About this task
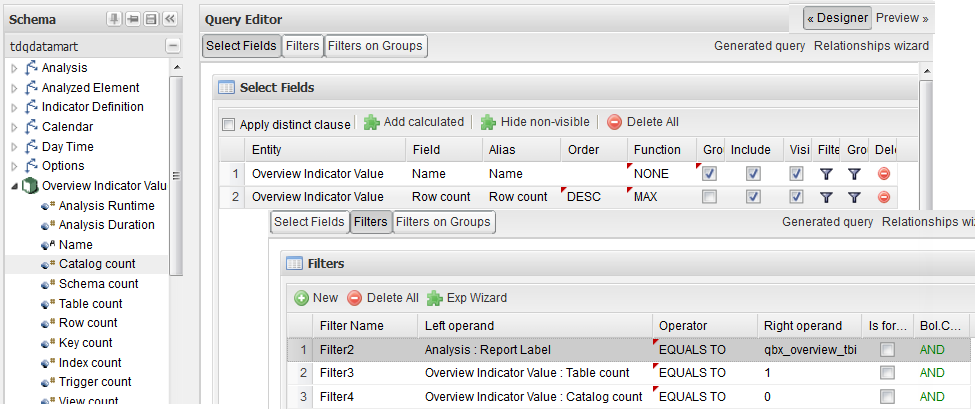
In this example the query interrogates the results of an overview analysis,
qbx_overview_tbi, in the datamart, retrieves the list of
tables, their names and the number of rows in each.
To build a worksheet for the query results, do the following:
Procedure
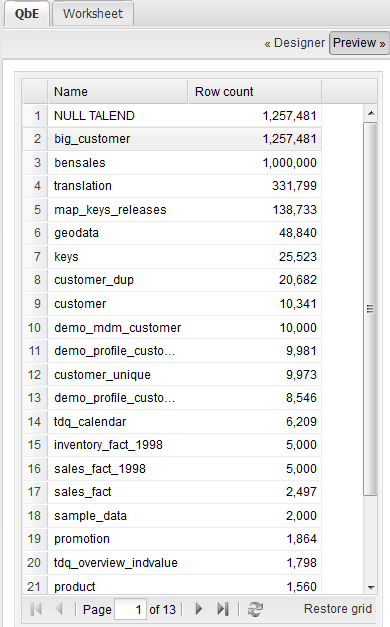
Click the Preview in the top right corner of
the page.
A loading indicator is displayed and then the Results view opens displaying the results of the query.
Example
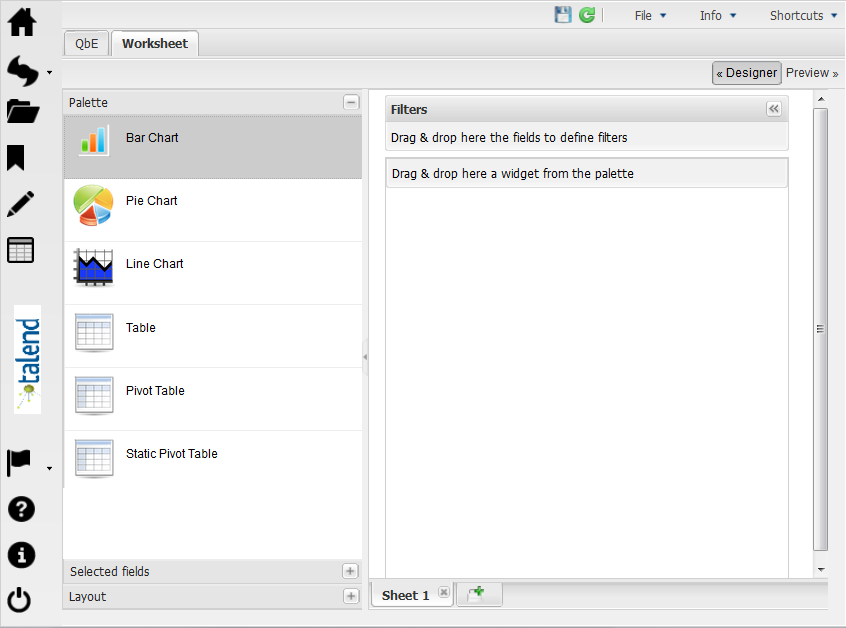
Click Worsksheet to open a view where you can
add one or several worksheets to this interrogation.
Example
From the Palette, drop the chart or the table
you want to use to display the query results to the right panel, a pie chart in
this example.
Example
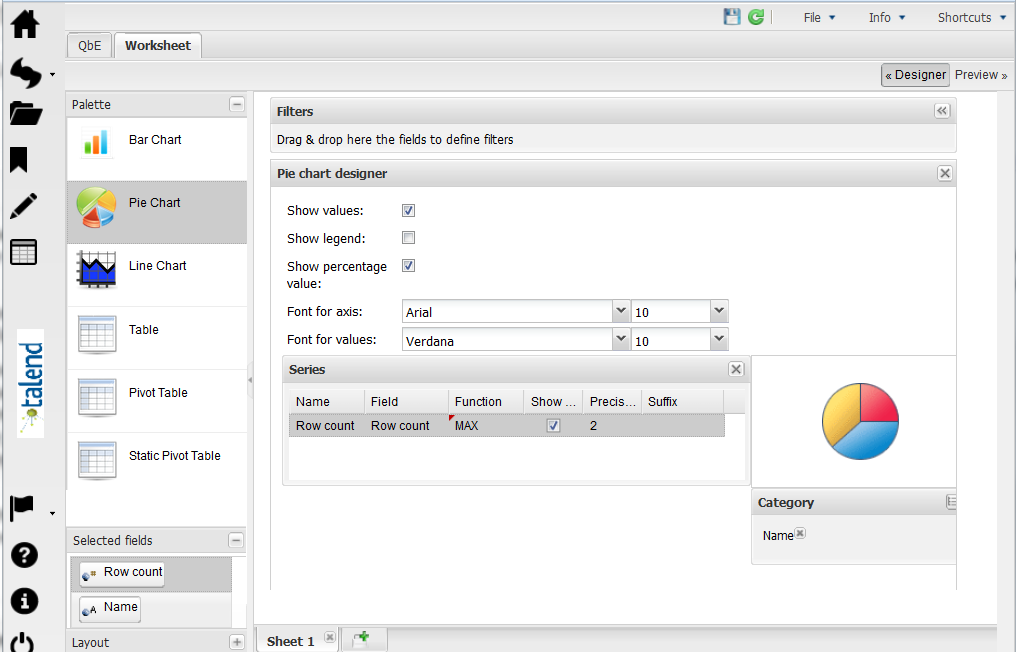
Click Selected fields at the bottom of the
Palette, drop the element you want to use
as category to the Category table and the
element you want to use as query measures to the Series table.
Select the check boxes of the information you want to show in the pie
chart.
It is not recommended to select the Show
legend check box if you have profiled too many tables in the
analysis. Otherwise you may have difficulty displaying the chart and the legend
together in your browser.
You can add several sheets to your interrogations through clicking the plus
button at the bottom of the worksheet and represent the query results in
different charts and tables.
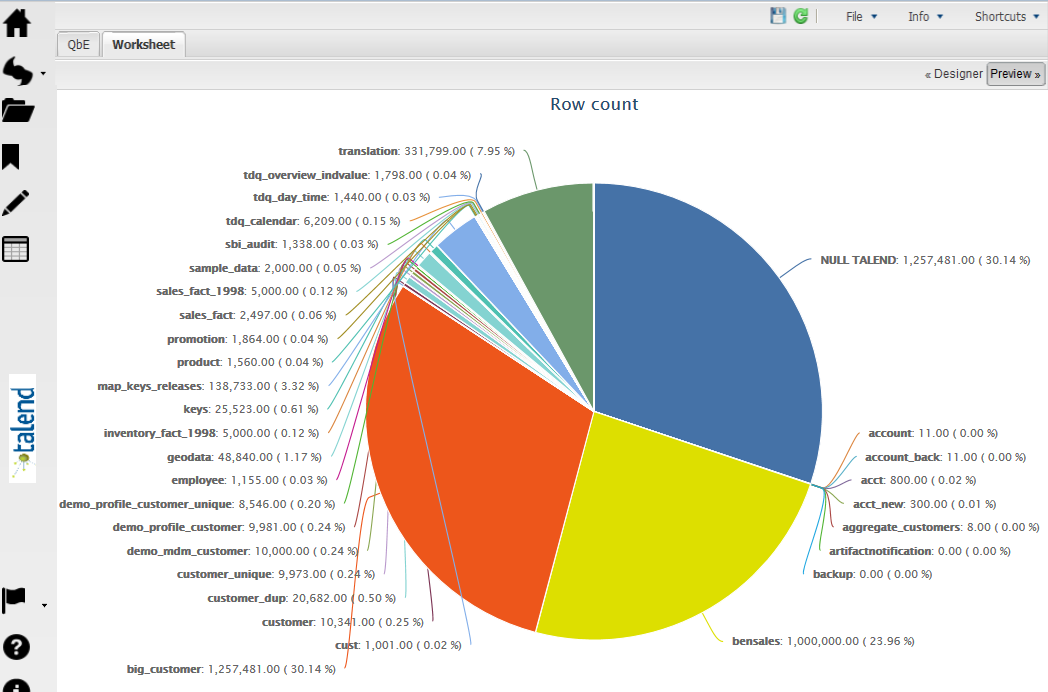
Click Preview to open the query results in a
pie chart.
Example
You can hide/show each of the table partitions in the pie chart by clicking
the table name in the chart legend, when the legend is displayed.
Click the save icon in the top right corner of the page to open a form.
Fill in the form and select a folder in which to save the worksheet, if
needed. Click Save.
The worksheet is saved in the selected folder and in the My analysis page.
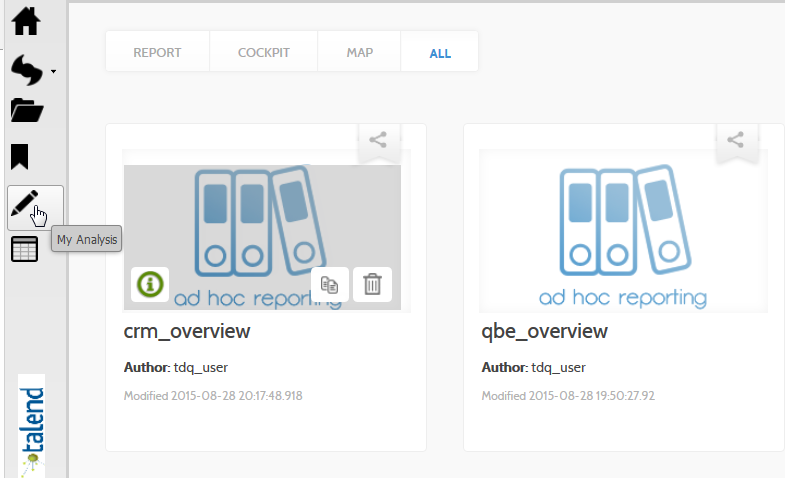
On the toolbar, click to open a page listing the saved worksheets.
Example
From this page, you can open the worksheet, clone or delete it.
Did this page help you?
If you find any issues with this page or its content – a typo, a missing step, or a technical error – please let us know!

 You can hide/show each of the table partitions in the pie chart by clicking the table name in the chart legend, when the legend is displayed.
 to open a page listing the saved worksheets.
 From this page, you can open the worksheet, clone or delete it.