
Maps can be used for a wide variety of purposes. A common use in business intelligence is to plot sales data per region or per store.
You can create a map by using either a point layer (KML or Excel file) or an area layer (KML file).
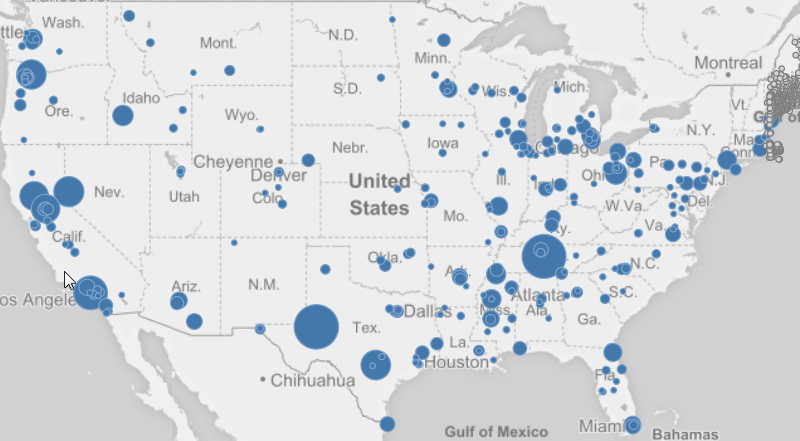
Maps with a point layer
A point layer map is typically used to mark places of interest, such as airports or office locations, using longitude and latitude coordinates.
In a simple implementation of a map with a point layer, all bubbles look the same. But by using an expression or a measure, you can let the bubble size reflect the value. In the properties panel, add an expression to the point layer, or drag a measure from Master items in the assets panel to the visualization.
You can also use coloring by measure or by expression to show differences in values.
If you use a point layer, you also need a background map to provide the context for the points. Otherwise you will only have a collection of points on an empty background. By default, a Mapbox background map is added to a point layer. If you want to, you can use a map from a different provider.
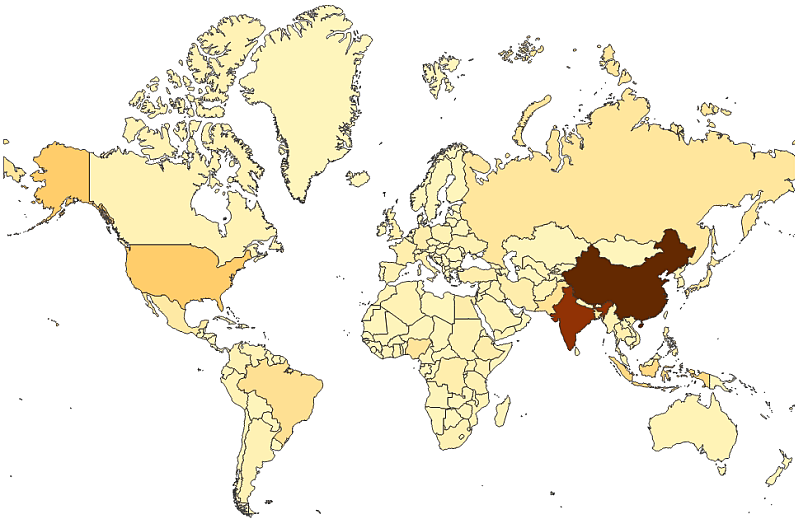
Maps with an area layer
An area map can be used to display geographical areas, such as countries.
If you use an area layer, you often do not need a background map, but there is support for complementing an area layer with a background.
With an area layer, each subarea is a dimension value. By using colors, you can differentiate between measure values. In the properties panel, under Appearance > Colors and legend, switch Colors to Custom where the options By measureand By expression are available.
When to use it
You can use a map to show the geographical distribution of offices, stores, and other sites of business interest. You can visualize not only locations but also sales values and other measures and display the value differences by bubble size or color.
| Advantages | Disadvantages |
|---|---|
| The map is a versatile visualization that efficiently presents the geographical distribution of key values related to location or area. | With a large number of values, it may be hard to get a good overview. Values may be placed on top of each other and not visible until zoomed in. |
Creating a map
To be able to create a map, you first need to load point data or area data.You can load point data (Excel or KML file) or area data (KML file). You load the data either through the data manager or the data load editor.
See: Loading map data
You can add a map to the sheet you are editing.
Do the following:
- From the assets panel, drag an empty map to the sheet.
-
Click Add dimension and select a dimension or a field.
Geo fields are marked with , .
- Select a field to represent point or area names on the map.
-
Add a dimension or measure to the map (optional).
Dimensions can be used to color a map.
Measures can be used to color a map or set the size of points on a point layer map.
You can only use a single dimension type: point or area. You can create an expression in the dimension. If you add a measure from the master items to the map, the measure is added in the expression box under Data > Layers > <layer type> in the properties panel.
When you have created the map, you may want to adjust its appearance and other settings in the properties panel.
Adding a background map
You can add a background map to both point maps and area maps. However, if you have added a point layer to your map, a CartoDB background map is automatically added. You can use maps from other providers.
Do the following:
-
In the toolbar, click @Edit.
-
In the properties panel to the right, click Background.
-
Switch Show to On.
-
Switch Map service to Custom.
-
After URL, enter the URL to a slippy map server.
For example, http://a.tile.opencyclemap.org/cycle/${z}/${x}/${y}.png .
-
After Attribution, enter the attribution string for the map.
For example, © <a href='http://www.opencyclemap.org/' target='_blank'>OpenCycleMap</a>. Map data © <a href='http://www.openstreetmap.org/copyright' target='_blank'>OpenStreetMap</a> contributors.