
You can open a sheet from the app overview. In sheet view, you can do the following:
- Analyze with the app. You make selections in the visualizations and go into detail in your data to gain insights.
- Take snapshots of visualizations. You use these static snapshots building stories in data storytelling.
- Develop (edit) the app. You create sheets and visualizations to be used for data analysis. You cannot edit sheets of a published app, but if you have the correct permissions, you can create your own private sheets. You can also load another data file into the app.
Depending on if the app you are working with is published or not, you find different options in the menus and different items in the panel on the left when editing.
Analyze
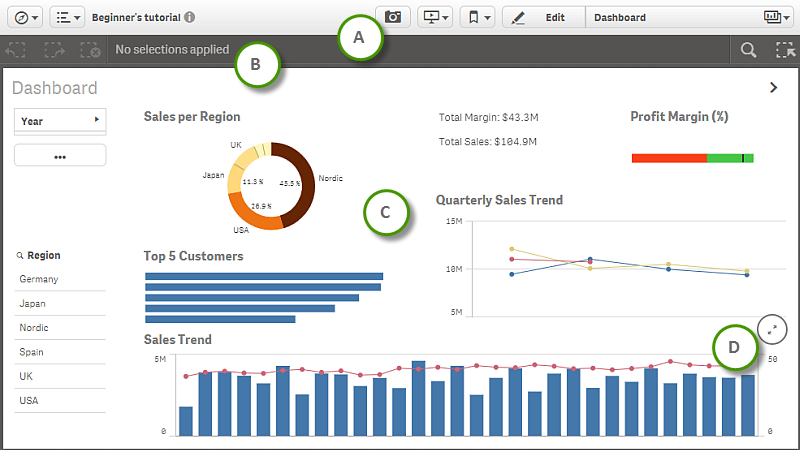
You start analyzing data on a sheet by making selections in the visualizations. You can quickly see and move around among the sheets with the sheet navigator.
| A |
The toolbar contains the navigation menu, the global menu and other useful commands.
|
|||||||||||||||||
| B | Manage selections by clearing all selections, stepping back or stepping forward in selections. | Working with selections | ||||||||||||||||
| C | The sheet with visualizations. | Sheets | ||||||||||||||||
| D |
To explore data on a detailed level you can expand and work with one visualization at a time on the sheet. |
Take snapshots
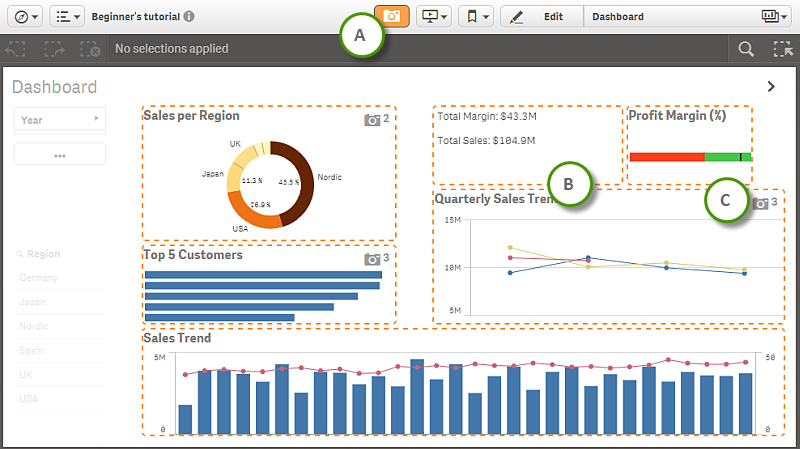
When you are in sheet view, you can take snapshots of the visualizations and use them to build a story in data storytelling. You can do this in the following ways:
- Take a single snapshot of a selected visualization.
- Take several snapshots of several visualizations at the same time.
You can take snapshots of all the different visualization types but not the filter panes.
| A |
Enable taking snapshots. |
|
| B | Marked visualizations can be used for snapshots. | |
| C | A snapshot indicator with the number of taken snapshots. View and manage the snapshots of a visualization. | Managing snapshots of a visualization |
Develop (edit)
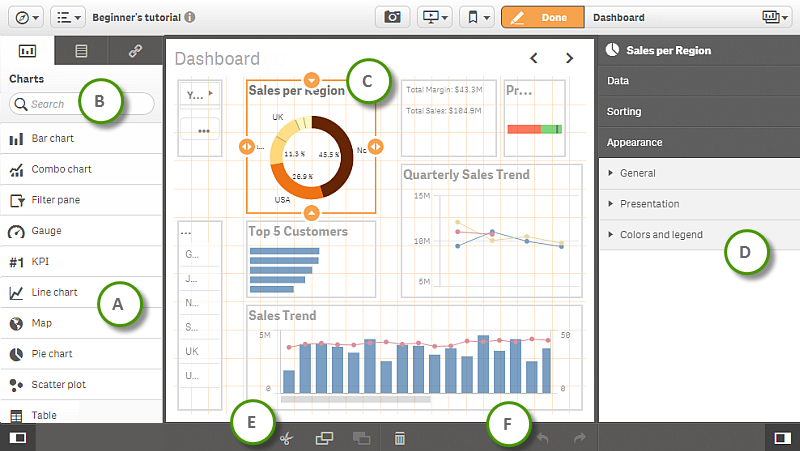
You enable editing of the sheet and its visualizations by clicking Edit in the toolbar. The properties panel opens on the right.
In an unpublished app, on the left, you find a panel with assets such as measures, dimensions, fields and charts. You can create measures and dimensions from the assets panel, to use when building visualizations.
In a published app, on the left, you find a panel with pre-made and ready-to-use master items (measures, dimensions and visualizations). You cannot update the existing sheets of a published app, but you can create new sheets to further develop the app.
| A |
In the assets panel of an unpublished app you find fields to use when creating dimensions and measures, and charts to use when creating visualizations. You can save dimensions, measures and visualizations as master items for reuse. Information notePublishing is not supported in Qlik Sense Desktop, which means that you have access to the assets panel only when using Qlik Sense Desktop.
In the library panel of a published app, you find pre-made and ready-to-use master items (measures, dimensions and visualizations) .You also find charts to use when creating your own visualizations. |
|
| B |
Search all items in the assets or library panel. |
|
| C | A selected visualization with resizing handles. | |
| D | Properties of the selected visualization or the sheet. The properties for the sheet is shown if you have not selected a visualization. | |
| E | Cut, copy, paste and delete items on the sheet. | |
| F | Undo and redo. |
Touch gestures in the sheet view
The table describes the touch gestures that are used in the sheet view.
| Long-touch and release | Open the shortcut menu |
| Long-touch a visualization | Open the options menu |
| Swipe | Scroll lists and visualizations |
| Pinch | Zoom in or out on visualizations |
| Two-finger tap | Select an interval in a list, table or bar chart axis |
| Two-finger swipe | Pan a scatter plot visualization |
| Three-finger tap | Reset the zoom level of a scatter plot visualization |