
Bottom() evaluates an expression at the last (bottom) row of a column segment in a table. The row for which it is calculated depends on the value of offset, if present, the default being the bottom row. For charts other than tables, the evaluation is made on the last row of the current column in the chart's straight table equivalent.
Syntax:
Bottom([TOTAL] expr [ , offset [,count ]])
Return data type: dual
Arguments:
| Argument | Description |
|---|---|
| expr | The expression or field containing the data to be measured. |
| offset |
Specifying an offsetn greater than 1 moves the evaluation of the expression up n rows above the bottom row. Specifying a negative offset number makes the Bottom function work like the Top function with the corresponding positive offset number. |
| count |
By specifying a third parameter count greater than 1, the function will return not one but a range of count values, one for each of the last count rows of the current column segment. In this form, the function can be used as an argument to any of the special range functions. Range functions |
| TOTAL |
If the table is one-dimensional or if the qualifier TOTAL is used as argument, the current column segment is always equal to the entire column. |
Limitations:
-
Recursive calls will return NULL.
-
Sorting on y-values in charts or sorting by expression columns in tables is not allowed when this chart function is used in any of the chart's expressions. These sort alternatives are therefore automatically disabled. When you use this chart function in a visualization or table, the sorting of the visualization will revert back to the sorted input to this function.
Examples and results:
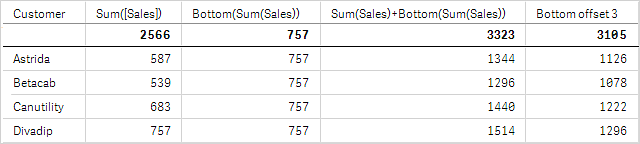
In the screenshot of the table shown in this example, the table visualization is created from the dimension Customer and the measures: Sum(Sales) and Bottom(Sum(Sales)).
The column Bottom(Sum(Sales)) returns 757 for all rows because this is the value of the bottom row: Divadip.
The table also shows more complex measures: one created from Sum(Sales)+Bottom(Sum(Sales)) and one labeled Bottom offset 3, which is created using the expression Sum(Sales)+Bottom(Sum(Sales), 3) and has the argument offset set to 3. It adds the Sum(Sales) value for the current row to the value from the third row from the bottom row, that is, the current row plus the value for Betacab.
Example: 2
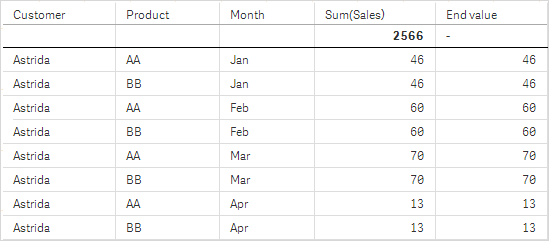
In the screenshots of tables shown in this example, more dimensions have been added to the visualizations: Month and Product. For charts with more than one dimension, the results of expressions containing the Above, Below, Top, and Bottom functions depend on the order in which the column dimensions are sorted by Qlik Sense. Qlik Sense evaluates the functions based on the column segments that result from the dimension that is sorted last. The column sort order is controlled in the properties panel under Sorting and is not necessarily the order in which the columns appear in a table.
In the first table, the expression is evaluated based on Month, and in the second table it is evaluated based on Product. The measure End value contains the expression Bottom(Sum(Sales)). The bottom row for Month is Dec, and the value for Dec both the values of Product shown in the screenshot is 22. (Some rows have been edited out of the screenshot to save space.)
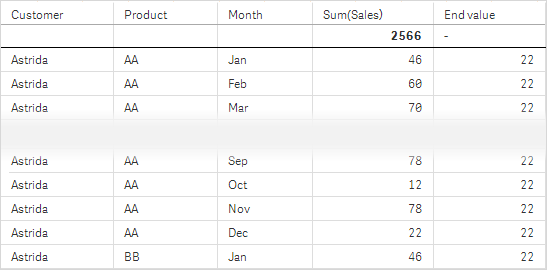
Please refer to Example: 2 in the Above function for further details.
|
Example: 3 |
Result | ||
|---|---|---|---|
|
The Bottom function can be used as input to the range functions. For example: RangeAvg (Bottom(Sum(Sales),1,3)). |
In the arguments for the Bottom() function, offset is set to 1 and count is set to 3. The function finds the results of the expressionSum(Sales) on the three rows starting with the row above the bottom row in the column segment (because offset=1), and the two rows above that (where there is a row). These three values are used as input to the RangeAvg() function, which finds the average of the values in the supplied range of numbers. A table with Customer as dimension gives the following results for the RangeAvg() expression. |
||
|