
RGB() returns an integer corresponding to the color code of the color defined by the three parameters: the red component r, the green component g, and the blue component b. These components must have integer values between 0 and 255. The function can be used in expressions to set or evaluate the color properties of a chart object.
Syntax:
RGB (r, g, b)
Return data type: dual
Arguments:
| Argument | Description |
|---|---|
| r, g, b | Red, green, and blue component values. A color component of 0 corresponds to no contribution and one of 255 to full contribution. |
If interpreting the numeric component and formatting it in hexadecimal notation, the values of the color components are easier to see. For example, light green has the number 4 278 255 360, which in hexadecimal notation is FF00FF00. The first two positions ‘FF’ (255) denote the alpha channel. In the functions RGB and HSL, this is always ‘FF’ (opaque). The next two positions ‘00’ denote the amount of red, the next two positions ‘FF’ denote the amount of green, and the final two positions ‘00’ denote the amount of blue.
This example applies a custom color to a chart:
Data used in this example:
ProductSales:
Load * Inline
[Country,Sales,Budget
Sweden,100000,50000
Germany, 125000, 175000
Norway, 74850, 68500
Ireland, 45000, 48000
Sweden,98000,50000
Germany, 115000, 175000
Norway, 71850, 68500
Ireland, 31000, 48000
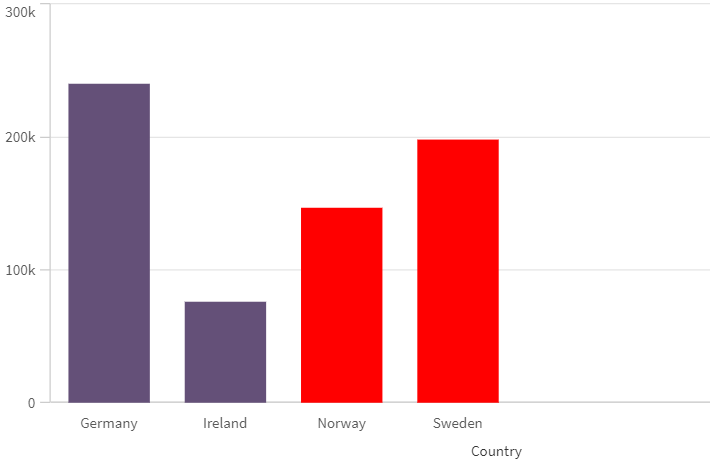
] (delimiter is ',');Enter the following expression in the Colors and legend properties panel:
If (Sum(Sales)>Sum(Budget),RGB(255,0,0),RGB(100,80,120))
Result:
Refer to Coloring a visualization to find examples of how to use the color functions in visualizations, as well as details on the visualizations that support color by expression.