
The linest functions are used to find values associated with linear regression analysis. This section describes how to build visualizations using sample data to find the values of the linest functions available in Qlik Sense. The linest functions can be used in the data load script and in chart expressions.
Refer to the individual linest chart function and script function topics for descriptions of syntax and arguments.
Data and script expressions used in the examples
Load the following inline data and script expressions in the data load editor for the linest() examples below.
T1:
LOAD *, 1 as Grp;
LOAD * inline [
X|Y
1|0
2|1
3|3
4|8
5|14
6|20
7|0
8|50
9|25
10|60
11|38
12|19
13|26
14|143
15|98
16|27
17|59
18|78
19|158
20|279 ] (delimiter is '|');

R1:
LOAD
Grp,
linest_B(Y,X) as Linest_B,
linest_DF(Y,X) as Linest_DF,
linest_F(Y,X) as Linest_F,
linest_M(Y,X) as Linest_M,
linest_R2(Y,X) as Linest_R2,
linest_SEB(Y,X,1,1) as Linest_SEB,
linest_SEM(Y,X) as Linest_SEM,
linest_SEY(Y,X) as Linest_SEY,
linest_SSREG(Y,X) as Linest_SSREG,
linest_SSRESID(Y,X) as Linest_SSRESID
resident T1 group by Grp;
For more information about using inline loads, see Inline loads.
Example 1: Script expressions using linest
Example 2: Chart expressions using linest
Example 3: Chart expressions using linest
- Create a barchart visualization in a Qlik Sense sheet with X as a dimension and Y as a measure.
- Add a linear trend line to the Y measure.
- Add a KPI visualization to the sheet.
- Add slope as a label for the KPI.
- Add sum(Linest_M) as an expression for the KPI.
- Add a second KPI visualization to the sheet.
- Add intercept as a label for the KPI.
- Add Sum(Linest_B) as an expression for the KPI.
- Add a third KPI visualization to the sheet.
- Add coefficient of determination as a label for the KPI.
- Add Sum(Linest_R2) as an expression for the KPI.
Result
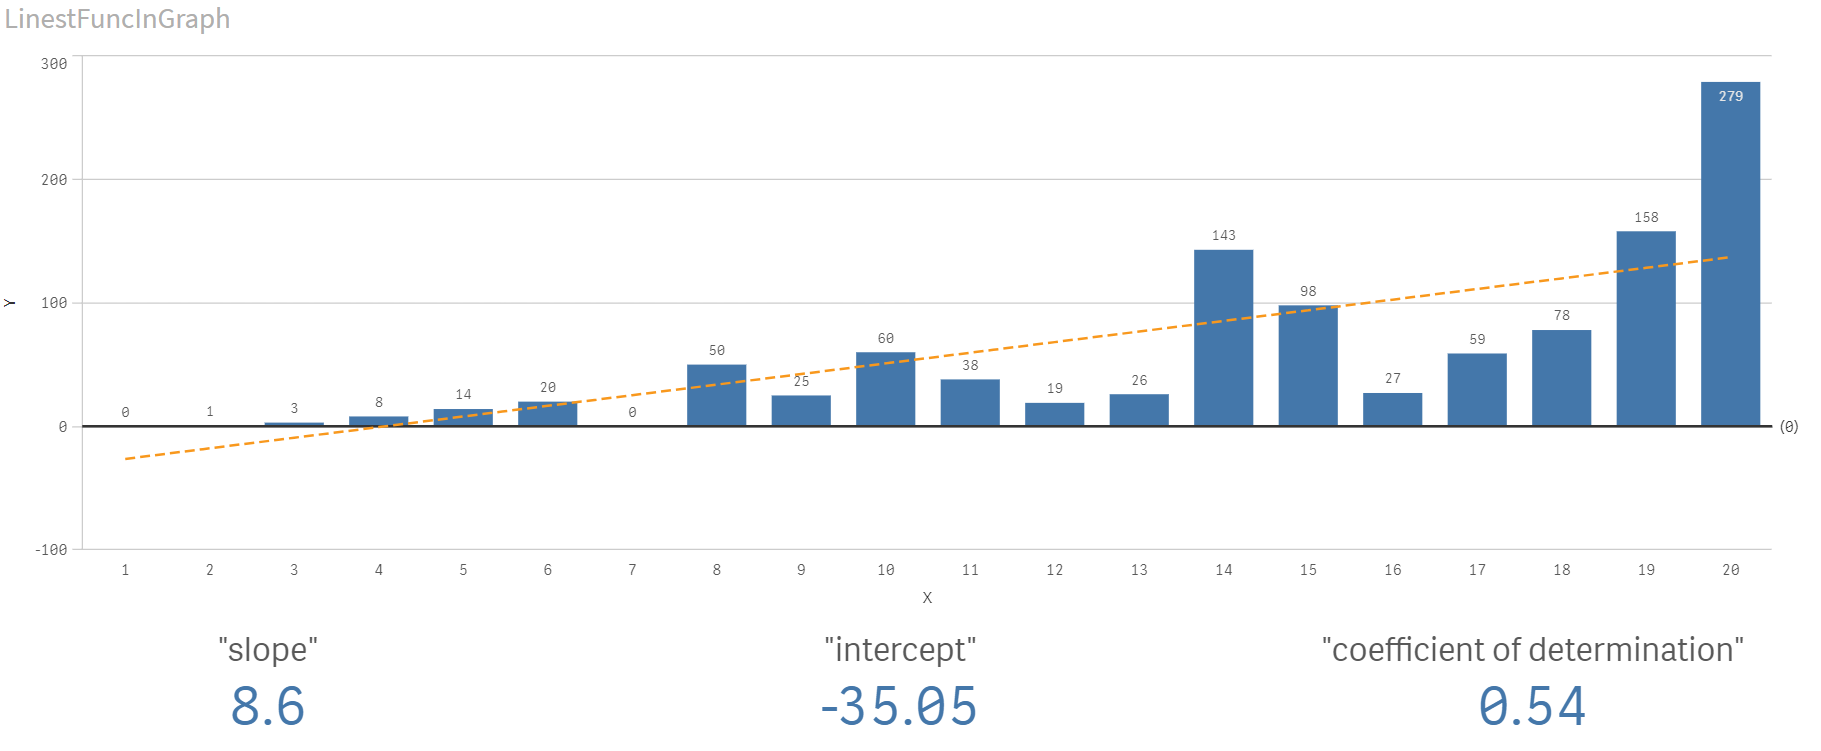
Explanation
The barchart shows the plotting of the X and Y data. Relevant linest() functions provide values for the linear regression equation that the trend line is based on, namely y = m * x + b. The equation uses the "least squares" method to calculate a straight line (trend line) by returning an array that describes a line that best fits the data.
The KPIs display the results of the linest() functions sum(Linest_M) for slope and sum(Linest_B) for the Y intercept, which are variables in the linear regression equation, and the corresponding aggregated R2 value for coefficient of determination.