Expand/Collapse all Creating box plots ON THIS PAGE This section describes how to create box plots with the Visualization API and qlik-visual.
Creating a basic box plot
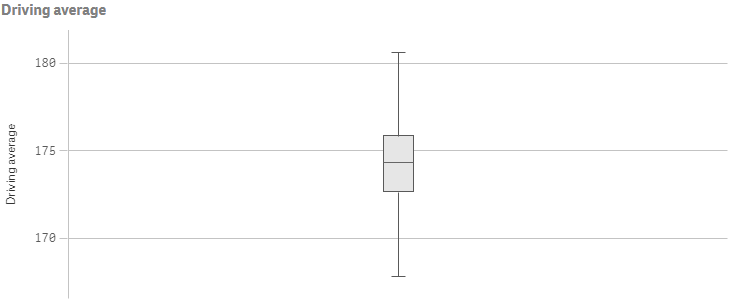
In this example we want to create a basic box plot, containing one dimension and one measure, and with a custom title.
Create the chartCreate the container for the chart. The visualization type is boxplot .
Visualization API
app. visualization. create(
'boxplot' ,
[ ] ,
{ }
) Copy code to clipboard qlik-visual
< qlik-visualappid = " Tutorial-Golf.qvf" type = " boxplot" cols = '[]'options = '{}'> </ qlik-visual> Copy code to clipboard
Define the dimension and the measure as columns[
{
"qDef": {
"qFieldDefs": [
"Date.autoCalendar.Year"
],
"qFieldLabels": [
"Year"
]
}
},
{
"qDef": {
"qLabel": "Driving average",
"qDef": "Avg({<Par={'4','5'}>}DrDist)"
}
}
]
Define the title in the options{
"showTitles": true,
"title": "Driving average"
}
Result
Code examples
Visualization API
app. visualization. create(
'boxplot' ,
[
{
"qDef" : {
"qFieldDefs" : [
"Date.autoCalendar.Year"
] ,
"qFieldLabels" : [
"Year"
]
}
} ,
{
"qDef" : {
"qLabel" : "Driving average" ,
"qDef" : "Avg({<Par={'4','5'}>}DrDist)"
}
}
] ,
{
"showTitles" : true ,
"title" : "Driving average"
}
) . then( function ( vis) {
vis. show( "QV01" ) ;
} ) ; Copy code to clipboard qlik-visual
< qlik-visualappid = " Tutorial-Golf.qvf" type = " boxplot" cols = '[
{
" qDef" : {
" qFieldDefs" : [
" Date.autoCalendar.Year"
],
" qFieldLabels" : [
" Year"
]
}
},
{
" qDef" : {
" qLabel" : " Driving average" ,
" qDef" : " Avg({<Par= {4,5}> }DrDist)"
}
}
]'options = '{
" showTitles" : true,
" title" : " Driving average"
}'> </ qlik-visual> Copy code to clipboard Calculation presets and presentation
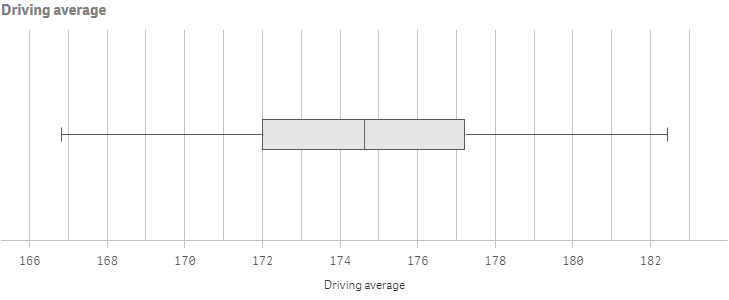
The box plot elements are configured in the options within the boxplotDef . You can select to use one of three calculation preset modes:
Set the preset modeIn this example we select to use the Standard deviation preset with two standard deviations.
"boxplotDef": {
/*Standard deviation preset*/
"calculations": {
"auto": true,
"mode": "stdDev",
"parameters": {
"stdDev": 3
}
}
}
Show whiskersEnable ticks at the end of each whisker: "presentation": {"whiskers": {"show": true}} .
"boxplotDef": {
/*Standard deviation preset*/
"calculations": {
"auto": true,
"mode": "stdDev",
"parameters": {
"stdDev": 3
}
},
/*Show whiskers*/
"presentation": {
"whiskers": {
"show": true
}
}
}
OrientationYou might also want to change the way the box plot is presented by changing to horizontal orientation: "orientation": "horizontal" .
"orientation": "horizontal"
Grid line spacingThis example also uses narrow grid line spacing.
"orientation": "horizontal",
"gridlines": {
"auto": false,
"spacing": 3
}
Result
Code examples
Visualization API
app. visualization. create(
'boxplot' ,
[
{
"qDef" : {
"qFieldDefs" : [
"Date.autoCalendar.Year"
] ,
"qFieldLabels" : [
"Year"
]
}
} ,
{
"qDef" : {
"qLabel" : "Driving average" ,
"qDef" : "Avg({<Par={'4','5'}>}DrDist)"
}
}
] ,
{
"boxplotDef" : {
"calculations" : {
"auto" : true ,
"mode" : "stdDev" ,
"parameters" : {
"stdDev" : 3
}
} ,
"presentation" : {
"whiskers" : {
"show" : true
}
}
} ,
"showTitles" : true ,
"title" : "Driving average" ,
"orientation" : "horizontal" ,
"gridlines" : {
"auto" : false ,
"spacing" : 3
}
}
) . then( function ( vis) {
vis. show( "QV01" ) ;
} ) ; Copy code to clipboard qlik-visual
< qlik-visualappid = " Tutorial-Golf.qvf" type = " boxplot" cols = '[
{
" qDef" : {
" qFieldDefs" : [
" Date.autoCalendar.Year"
],
" qFieldLabels" : [
" Year"
]
}
},
{
" qDef" : {
" qLabel" : " Driving average" ,
" qDef" : " Avg({<Par= {4,5}> }DrDist)"
}
}
]'options = '{
" boxplotDef" : {
" calculations" : {
" auto" : true,
" mode" : " stdDev" ,
" parameters" : {
" stdDev" : 3
}
},
" presentation" : {
" whiskers" : {
" show" : true
}
}
},
" showTitles" : true,
" title" : " Driving average" ,
" orientation" : " horizontal" ,
" gridlines" : {
" auto" : false,
" spacing" : 3
}
}'> </ qlik-visual> Copy code to clipboard Color settings
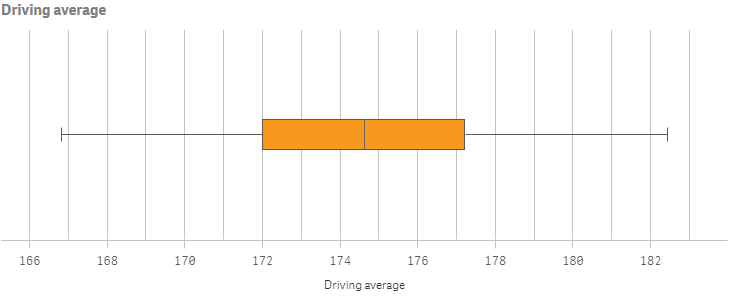
In this example we will add custom colors to the box and the points.
Box colorBox color settings are specified in the color object within the boxplotDef .
"color": {
/*Box color*/
"box": {
"paletteColor": {
"index": 9,
"color": "#f8981d"
}
}
}
Point / outlier colorPoint, or outlier, color settings are also specified in the color object within the boxplotDef .
"color": {
/*Box color*/
"box": {
"paletteColor": {
"index": 9,
"color": "#f8981d"
}
},
/*Outlier color*/
"point": {
"paletteColor": {
"index": -1,
"color": "#214152"
}
}
}
Result
Code examples
Visualization API
app. visualization. create(
'boxplot' ,
[
{
"qDef" : {
"qFieldDefs" : [
"Date.autoCalendar.Year"
] ,
"qFieldLabels" : [
"Year"
]
}
} ,
{
"qDef" : {
"qLabel" : "Driving average" ,
"qDef" : "Avg({<Par={'4','5'}>}DrDist)"
}
}
] ,
{
"boxplotDef" : {
"calculations" : {
"auto" : true ,
"mode" : "stdDev" ,
"parameters" : {
"stdDev" : 3
}
} ,
"presentation" : {
"whiskers" : {
"show" : true
}
} ,
"color" : {
"box" : {
"paletteColor" : {
"index" : 9 ,
"color" : "#f8981d"
}
} ,
"point" : {
"paletteColor" : {
"index" : - 1 ,
"color" : "#214152"
}
}
}
} ,
"showTitles" : true ,
"title" : "Driving average" ,
"orientation" : "horizontal" ,
"gridlines" : {
"auto" : false ,
"spacing" : 3
}
}
) . then( function ( vis) {
vis. show( "QV01" ) ;
} ) ; Copy code to clipboard qlik-visual
< qlik-visualappid = " Tutorial-Golf.qvf" type = " boxplot" cols = '[
{
" qDef" : {
" qFieldDefs" : [
" Date.autoCalendar.Year"
],
" qFieldLabels" : [
" Year"
]
}
},
{
" qDef" : {
" qLabel" : " Driving average" ,
" qDef" : " Avg({<Par= {4,5}> }DrDist)"
}
}
]'options = '{
" boxplotDef" : {
" calculations" : {
" auto" : true,
" mode" : " stdDev" ,
" parameters" : {
" stdDev" : 3
}
},
" presentation" : {
" whiskers" : {
" show" : true
}
},
" color" : {
" box" : {
" paletteColor" : {
" index" : 9,
" color" : " #f8981d"
}
},
" point" : {
" paletteColor" : {
" index" : -1,
" color" : " #214152"
}
}
}
},
" showTitles" : true,
" title" : " Driving average" ,
" orientation" : " horizontal" ,
" gridlines" : {
" auto" : false,
" spacing" : 3
}
}'> </ qlik-visual> Copy code to clipboard Using inner and outer dimensions
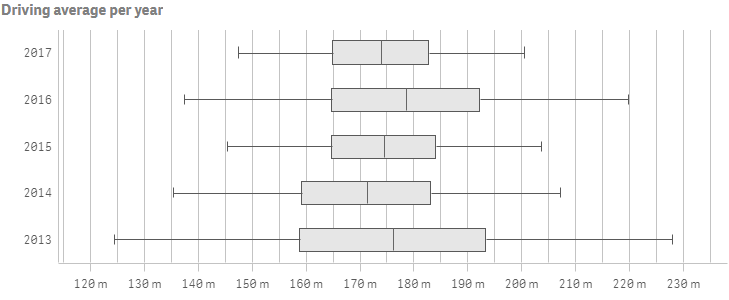
When creating box plots with a single dimension, you will receive a single box visualization. In this example we will add a second dimension which will give us one box for each value of the second, or outer, dimension.
Adding the inner dimensionThis example uses Date as the inner dimension. Dimensions are defined as columns.
{
/*Inner dimension*/
"qDef": {
"qFieldDefs": [
"Date.autoCalendar.Date"
],
"qFieldLabels": [
"Date"
]
}
}
Adding the outer dimensionThis example uses Year as the outer dimension. Dimensions are defined as columns.
{
/*Inner dimension*/
"qDef": {
"qFieldDefs": [
"Date.autoCalendar.Date"
],
"qFieldLabels": [
"Date"
]
}
},
{
/*Outer dimension*/
"qDef": {
"qFieldDefs": [
"Date.autoCalendar.Year"
],
"qFieldLabels": [
"Year"
]
}
}
Adding the measureWe then add a measure with some special number formatting. The measure to be used is average driving distance on par 4 and par 5 holes, which is added as a set statement. We define that the letter m (meaning meters ) precedes the number on the measure axis.
{
"qDef": {
"qLabel": "Driving average",
"qDef": "Avg({<Par={'4','5'}>}DrDist)",
/*Special number format*/
"qNumFormat": {
"qType": "F",
"qnDec": 2,
"qUseThou": 0,
"qFmt": "#,##0 m"
},
"numFormatFromTemplate": false
}
}
Measure axisThis example shows only labels and uses narrow scale on the measure axis.
"measureAxis": {
"show": "labels",
"spacing": 0.5
}
Dimension axisThis example shows only labels on the dimension axis.
"measureAxis": {
"show": "labels",
"spacing": 0.5
},
"dimensionAxis": {
"show": "labels"
}
Result
Code examples
Visualization API
app. visualization. create(
'boxplot' ,
[
{
"qDef" : {
"qFieldDefs" : [
"Date.autoCalendar.Date"
] ,
"qFieldLabels" : [
"Date"
]
}
} ,
{
"qDef" : {
"qFieldDefs" : [
"Date.autoCalendar.Year"
] ,
"qFieldLabels" : [
"Year"
]
}
} ,
{
"qDef" : {
"qLabel" : "Driving average" ,
"qDef" : "Avg({<Par={'4','5'}>}DrDist)" ,
"qNumFormat" : {
"qType" : "F" ,
"qnDec" : 2 ,
"qUseThou" : 0 ,
"qFmt" : "#,##0 m"
} ,
"numFormatFromTemplate" : false
}
}
] ,
{
"boxplotDef" : {
"calculations" : {
"auto" : true ,
"mode" : "stdDev" ,
"parameters" : {
"stdDev" : 3
}
} ,
"presentation" : {
"whiskers" : {
"show" : true
}
} ,
"sorting" : {
"autoSort" : false ,
"elementId" : "firstWhisker" ,
"sortCriteria" : {
"sortByNumeric" : - 1
}
}
} ,
"showTitles" : true ,
"title" : "Driving average per year" ,
"orientation" : "horizontal" ,
"gridlines" : {
"auto" : false ,
"spacing" : 3
} ,
"measureAxis" : {
"show" : "labels" ,
"spacing" : 0.5
} ,
"dimensionAxis" : {
"show" : "labels"
}
}
) . then( function ( vis) {
vis. show( "QV01" ) ;
} ) ; Copy code to clipboard qlik-visual
< qlik-visualappid = " Tutorial-Golf.qvf" type = " boxplot" cols = '[
{
" qDef" : {
" qFieldDefs" : [
" Date.autoCalendar.Date"
],
" qFieldLabels" : [
" Date"
]
}
},
{
" qDef" : {
" qFieldDefs" : [
" Date.autoCalendar.Year"
],
" qFieldLabels" : [
" Year"
]
}
},
{
" qDef" : {
" qLabel" : " Driving average" ,
" qDef" : " Avg({<Par= {4,5}> }DrDist)" ,
" qNumFormat" : {
" qType" : " F" ,
" qnDec" : 2,
" qUseThou" : 0,
" qFmt" : " #,##0 m" ,
" qDec" : " ." ,
" qThou" : " ,"
},
" numFormatFromTemplate" : false
}
}
]'options = '{
" boxplotDef" : {
" calculations" : {
" auto" : true,
" mode" : " stdDev" ,
" parameters" : {
" stdDev" : 3
}
},
" presentation" : {
" whiskers" : {
" show" : true
}
},
" sorting" : {
" autoSort" : false,
" elementId" : " firstWhisker" ,
" sortCriteria" : {
" sortByNumeric" : -1
}
}
},
" showTitles" : true,
" title" : " Driving average per year" ,
" orientation" : " horizontal" ,
" gridlines" : {
" auto" : false,
" spacing" : 3
},
" measureAxis" : {
" show" : " labels" ,
" spacing" : 0.5
},
" dimensionAxis" : {
" show" : " labels"
}
}'> </ qlik-visual> Copy code to clipboard


