
The are some typical properties used for the most common native Qlik Sense visualizations:
- All native visualizations have an Appearance section with a section header General.
- Most native visualizations allow Dimensions and Measures to be defined.
Defining properties
If you create a visualization extension without defining a properties panel, Qlik Sense will per default include the Appearance section.
The same result will be achieved by reusing the settings section, which is the internal name for the Appearance section.
define( [
'jquery'
],
function ( $ ) {
'use strict';
return {
// Define what the properties panel looks like
definition: {
type: "items",
component: "accordion",
items: {
appearance: {
uses: "settings",
}
}
},
// Paint/Rendering logic
paint: function ( $element /*, layout*/ ) {
$element.empty();
var $msg = $( document.createElement( 'div' ) );
$msg.html( 'Just demonstrating default behavior of the property panel"' );
$element.append( $msg );
}
};
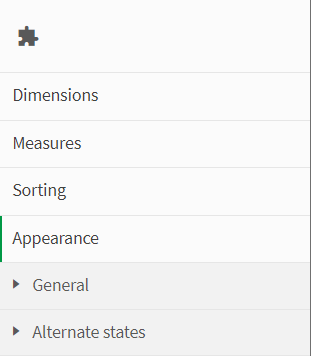
} );Based on the code above you can now extend definition to reuse other built-in sections. In this example we will also reuse the dimensions, measures and sorting sections.
			// Define what the properties panel looks like
			definition: {
				type: "items",
				component: "accordion",
				items: {
					dimensions: {
						uses: "dimensions"
					},
					measures: {
						uses: "measures"
					},
					sorting: {
						uses: "sorting"
					},
					appearance: {
						uses: "settings",
					}
				}
			},
This will result in the following properties panel.
Referencing properties
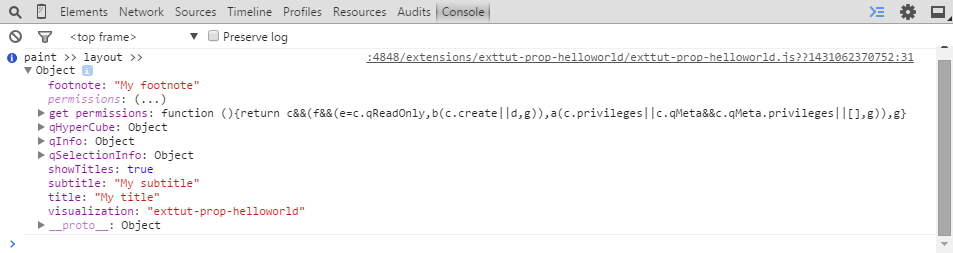
The layout parameter is passed to the paint method and it includes the current scope of the visualization extension together with the properties that are defined.
			// Paint/Rendering logic
			paint: function ( $element, layout ) {

				console.info('paint >> layout >> ', layout);

			}
If you look at the console output, in for example Chrome DevTools, you find what you are looking for.
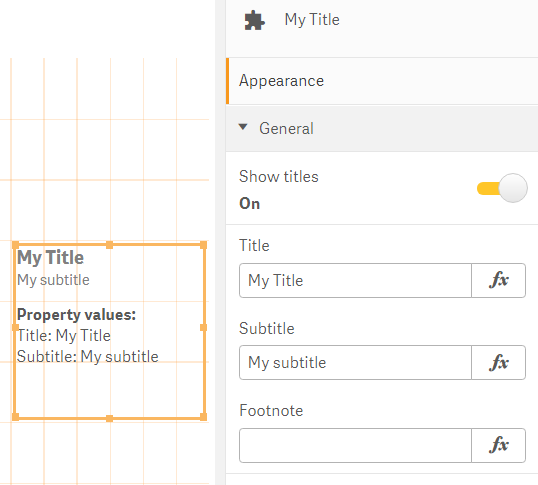
With this information you can now start to output some values into the paint method.
			// Paint/Rendering logic
			paint: function ( $element, layout ) {

				//output values from the property panel
				$element.empty();

				//output container
				var $msg = $( document.createElement( 'div' ) );

				//variable holding the output
				var html = '<b>Property values:</b><br/>';
				html += 'Title: ' + layout.title + '<br/>';
				html += 'Subtitle: ' + layout.subtitle + '<br/>';

				//assign the variable to the output container
				$msg.html( html );

				//add the output container to the current element
				$element.append( $msg );

			}
This will result in the following.
Native properties that can be reused
This section lists the native Qlik Sense properties that can be reused in your properties panel definition.
Dimensions
When you reuse the Dimensions section, it includes the following:
- Add dimension
When you have added a dimension, you have the following default properties:
- Field
- Label
- Show null values
- Limitation
- Show others
- Others label
Example: Add Dimensions section
The example below depicts how to add a Dimensions section to the properties panel of your visualization extension. Note that it is defined that the visualization extension must have exactly one dimension.
define( [], function ( ) {

	return {
		type: "items",
		component: "accordion",
		items: {
			dimensions: {
				uses: "dimensions",
				min: 1,
				max: 1
			}
		}
	};

});
Measures
When you reuse the Measures section, it includes the following:
- Add measure
When you have added a measure, you have the following default properties:
- Label
- Expression
- Number formatting
Example: Add Measures section
This example depicts how we now also have added the definition of the Measures section to the properties panel of our visualization extension. Note that we also here define that the visualization extension must have exactly one measure.
define( [], function ( ) {

	return {
		type: "items",
		component: "accordion",
		items: {
			dimensions: {
				uses: "dimensions",
				min: 1,
				max: 1
			},
			measures: {
				uses: "measures",
				min: 1,
				max: 1
			}
		}
	};

});
Sorting
When you reuse the Sorting section, it includes the following:
- Labels of the dimension and measure used in the visualization extension
-
Sorting option (Auto or Custom)
The Custom option includes the following:
- Sort by expression (only available for dimensions)
- Sort numerically
- Sort alphabetically
- Sort by frequency (only available for filter panes)
Example: Add Sorting section
This example depicts how we now also have added the definition of the Sorting section to the property panel of your visualization extension. We have not made any alterations to the Sorting section pre-defined by Qlik Sense.
define( [], function ( ) {

	return {
		type: "items",
		component: "accordion",
		items: {
			dimensions: {
				uses: "dimensions",
				min: 1,
				max: 1
			},
			measures: {
				uses: "measures",
				min: 1,
				max: 1
			},
			sorting: {
				uses: "sorting"
			}
		}
	};

});
Add-ons
When you reuse the Add-ons section, it includes the following:
- Data handling
- Reference lines
Example: Add Add-ons section
This example depicts how we add the definition of the Add-ons section to the properties panel of your visualization extension. We have not made any alterations to the Add-ons section pre-defined by Qlik Sense.
define( [], function ( ) {

	return {
		type: "items",
		component: "accordion",
		items: {
			dimensions: {
				uses: "dimensions",
				min: 1,
				max: 1
			},
			measures: {
				uses: "measures",
				min: 1,
				max: 1
			},
			sorting: {
				uses: "sorting"
			},
			addons: {
				uses: "addons"
			}
		}
	};

});
Appearance (settings)
When you reuse the Appearance section, it includes the following:
-
General
Includes settings for Title, Subtitle and Footnote
- Presentation (only available for visualizations that have more than one dimension)
- Colors and legend (only available in some types of visualizations)
- X-axis (only available in some types of visualizations)
- Y-axis (only available in some types of visualizations)
Example: Add Appearance section
This example depicts how we add the definition of the Appearance section to the properties panel of your visualization extension. We have not made any alterations to the Add-ons section pre-defined by Qlik Sense.
define( [], function ( ) {

	return {
		type: "items",
		component: "accordion",
		items: {
			dimensions: {
				uses: "dimensions",
				min: 1,
				max: 1
			},
			measures: {
				uses: "measures",
				min: 1,
				max: 1
			},
			sorting: {
				uses: "sorting"
			},
			addons: {
				uses: "addons"
			},
			settings: {
				uses: "settings"
			}
		}
	};

});