
This topic describes how to bring in data into your visualization extension.
Creating the Hello-Data visualization extension
In this section you will create the container, the QEXT file and the main script file.
Create the container
Create a folder that will contain your assets. The folder should be created in the following location: C:\Users\[UserName]\Documents\Qlik\Sense\Extensions\.
Example:
C:\Users\[UserName]\Documents\Qlik\Sense\Extensions\Hello-Data
Create the QEXT file
The next step is to create a QEXT file in the folder we just created and name it Hello-Data.qext.
It should contain the following information:
Example: Hello-Data.qext
{
    "name" : "Hello Data",
    "description" : "Example on how to use data in visualization extensions",
    "icon" : "extension",
    "type" : "visualization",
    "version": "0.1.0",
    "preview" : "hellodata.png",
    "author": "Qlik"
}
Create the main script file
Then it is time to create the main script file. This is also placed in the same folder as the QEXT file and we name it Hello-Data.js. Paste the following code into the script file and then save it:
Example: Hello-Data.js
define( [],
    function ( ) {
        'use strict';

        return {
            definition: {},
            initialProperties: {},
            paint: function ( $element, layout ) {

                // Your code comes here

            }
        };
    } );
Additional assets
The QEXT file defines that a image named hellodata.png is to be used as a preview image. This file is included in the downloadable version of this example.
Defining the properties panel
Reusing the built-in capability of defining dimensions and measures has already been described.
Add the following code to the definition object of your visualization extension.
definition: {
type: "items",
component: "accordion",
items: {
dimensions: {
uses: "dimensions"
},
measures: {
uses: "measures"
},
sorting: {
uses: "sorting"
},
appearance: {
uses: "settings"
}
}
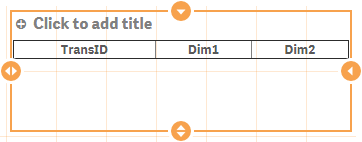
},The code above results in the following properties panel:
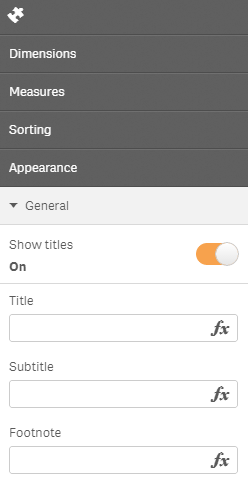
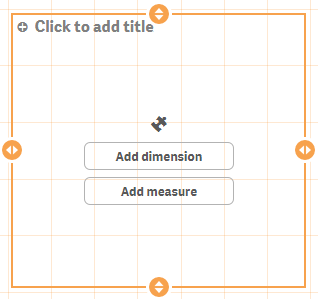
When you add the visualization extension to a sheet, you are able to define the dimensions and measures directly on the object without using the properties panel. You can also drag and drop master dimensions, master measures and fields onto the visualization extension.
Testing the visualization extension with data
If you want to test your visualization extension you can do so in an existing Qlik Sense app or you can create a new app. If you create a new app, you also need some data in order to create a sheet to put the visualization extension onto. In this section we create a new app and load data from the test script that comes with Qlik Sense.
Generating the test script
Do the following:
- Open Qlik Sense Desktop and create a new app. In this example we give the app the name Hello-Data.
- Open the app and select to load data using the Data load editor.
-
In the Data load editor, place the cursor at the bottom of the script area and press Ctrl+00.
The test script code is inserted into the script and it contains a few inline data fields.
-
Press the Load data button.
The data loads the app is automatically saved when completed.
Testing with even more data
If you want to test with more data, you can use a modified sample script:
Visualizing the data returned from Qlik associative engine
Now it is time to start working with the data returned from the Qlik associative engine. It is a good idea to visualize the data in a native Table, side by side with your new visualization extension.
Do the following:
- Create a new sheet.
- Add your visualization extension (Hello-Data) to the sheet.
- Add a Table to the sheet.
-
Add the same dimensions and measures to both your visualization extension and the table.
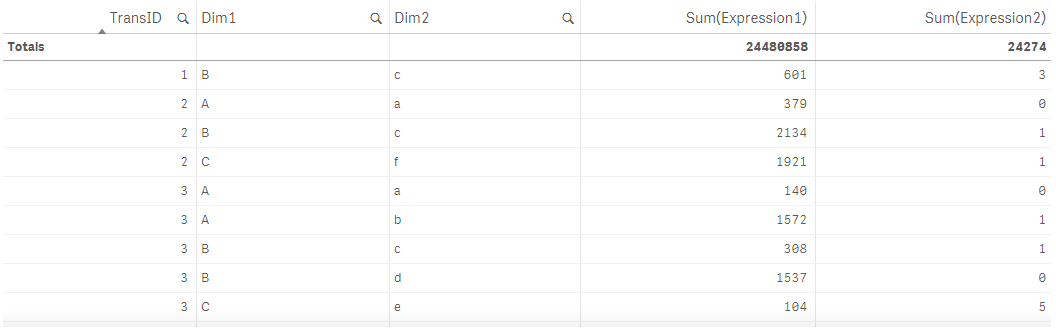
Based on the test data we previously loaded, select the following data:
Dimensions:
- TransId
- Dim1
- Dim2
Measures:
- Sum(Expression1)
- Sum(Expression2)
This results in a native Table looking something like this:
Retrieving the data in your visualization extension
When dimensions and measures have been added to a visualization extension, a hypercube is returned from Qlik associative engine.
In this section we use Chrome DevTools to output the hypercube to DevTool's console. To do so, change the paint section in the main script file as follows:
            paint: function ( $element, layout ) {

                console.log('Data returned: ', layout.qHyperCube);

            }
The console output:
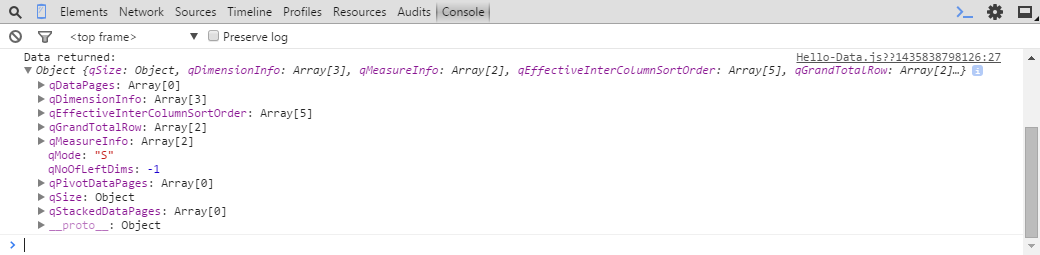
You can see the structure of the hypercube in the console output. Expand the following nodes to review:
- layout.qHyperCube.qDimensionInfo: dimensions used
- layout.qHyperCube.qMeasureInfo: measures used
- layout.qHyperCube.qDataPages: the result
Creating a HTML table
After reviewing the underlying data structure, you can create a simple HTML table to display the data. The HTML table should contain a header that includes the labels for the dimensions and measures, and a body that contains the data.
Skeleton
			paint: function ( $element, layout ) {

				var hc = layout.qHyperCube;
				console.log( 'Data returned: ', hc );

				$element.empty();
				var table = '<table border="1">';

					table += '<thead>';
					table += '</thead>';

					table += '<tbody>';
					table += '</tbody>';
				table += '</table>';
				$element.append( table );
			}
Table header
The table header should contain the labels for the dimensions and measures used in the visualization extension. Start by adding the dimension labels. Iterate through all existing dimensions using the hc.DimensionInfo array and then use the qFallbackTitle property which holds the label of the dimension.
					table += '<thead>';
						table += '<tr>';
							for (var i = 0; i < hc.qDimensionInfo.length; i++) {
								table += '<th>' + hc.qDimensionInfo[i].qFallbackTitle + '</th>';
							}
						table += '</tr>';
					table += '</thead>';
This results in the following:
Then you do the same for the measures:
					table += '<thead>';
						table += '<tr>';
							for (var i = 0; i < hc.qDimensionInfo.length; i++) {
								table += '<th>' + hc.qDimensionInfo[i].qFallbackTitle + '</th>';
							}
							for (var i = 0; i < hc.qMeasureInfo.length; i++) {
								table += '<th>' + hc.qMeasureInfo[i].qFallbackTitle + '</th>';
							}
						table += '</tr>';
					table += '</thead>';
This results in the following:
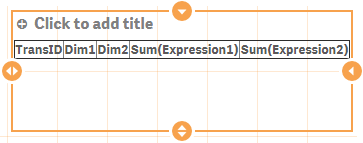
Table data
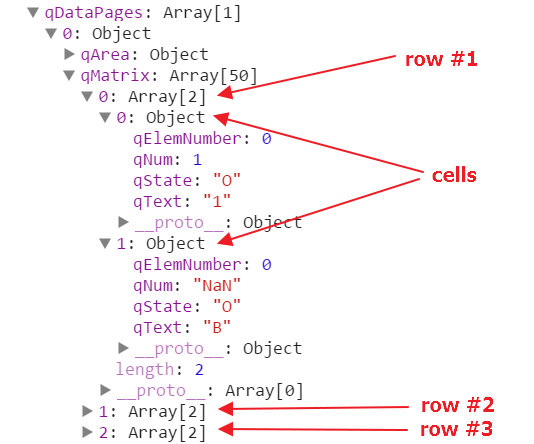
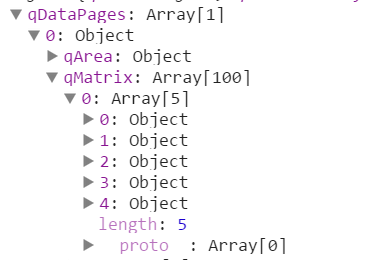
If you look at the console output and expand the qDataPages node, you will see that:
- qDataPages is an array
- The data is held with qDataPages[0].qMatrix
- qDataPages[0].qMatrix is an array of objects (the rows)
- The rows are holding an array of other objects (the cells)
If you expand qDataPages[0].qArea, you will see the default setting of how much data the Qlik associative engine returns. You may have noticed that the Qlik associative engine only returned two cells and the explanation can be found in qDataPages[0].qArea.
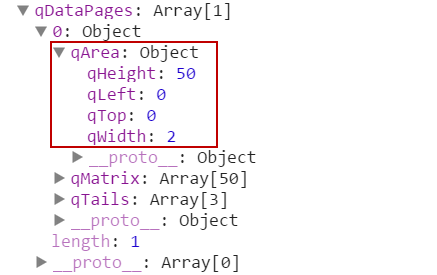
By default, the Qlik associative engine returns:
- 50 rows (qArea.qHeight)
- 2 columns (qArea.qWidth)
The default properties can be overruled in initialProperties, which is already part of the main script file.
Changing the initial properties
We change the qInitialDataFetch property to overrule the default properties and fetch 10 columns and 100 rows instead. To make the change take effect, remove your visualization extension from the sheet and then add it again.
Example: Updated initialProperties in Hello-Data.js
			initialProperties: {
				qHyperCubeDef: {
					qDimensions: [],
					qMeasures: [],
					qInitialDataFetch: [
						{
							qWidth: 10,
							qHeight: 100
						}
					]
				}
			},
After having updated the initialProperties, each row now have 5 cells.
Rendering table data
To render the rows and columns, you need to iterate over rows and then cells, similar to how you did when adding the headers above.
					table += '<tbody>';

						// iterate over all rows
						for (var r = 0; r < hc.qDataPages[0].qMatrix.length; r++) {
							table += '<tr>';

							// iterate over all cells within a row
							for (var c = 0; c < hc.qDataPages[0].qMatrix[r].length; c++) {
								table += '<td>';
									table += hc.qDataPages[0].qMatrix[r][c].qText;
								table += '</td>';
							}
							table += '</tr>';
						}
					table += '</tbody>';
Result:

You have now finished the task of bringing data into your visualization extension. Since the main objective of this example was to bring data into your visualization extension, you may notice that there are a few issues with the current implementation:
- The table is not scrollable.
- Only 100 rows are rendered (qHeight: 100) but the native table returns many more records.
- The current implementation does not support selections.
- The table is not styled.
Best practices
When you work with data, the following best practices may be helpful:
- Prove the data returned from Qlik associative engine by creating a native table using the same dimensions and measures.
- Use console.log wisely to understand the underlying data structure.
- Always add initialProperties to define how many rows and columns that are available in your JavaScript object.
- After changing initialProperties, remove your visualization extension from the sheet and then add it again.